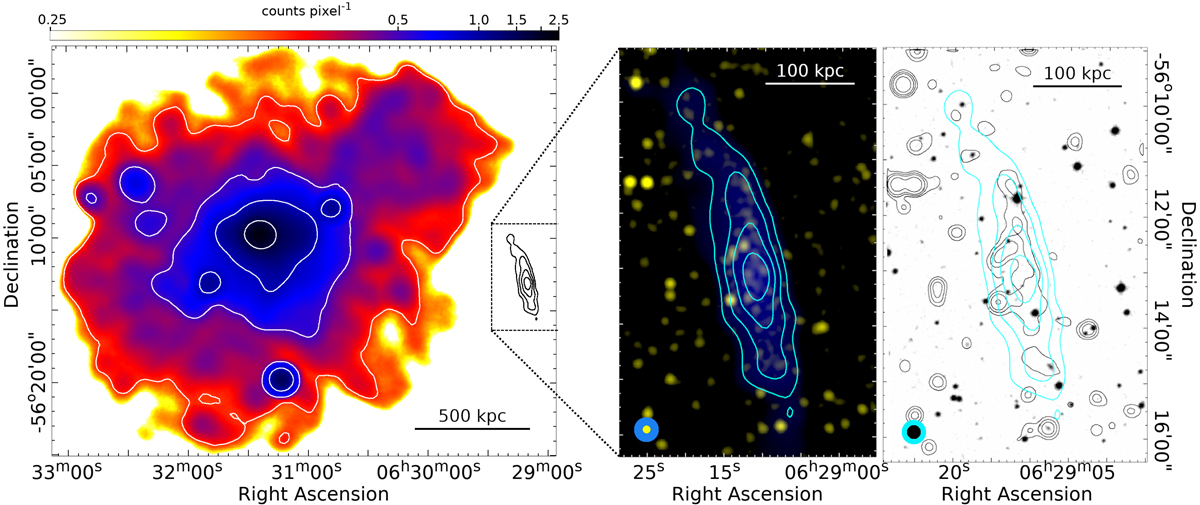
Fig. 13.
Download original image
Faint relic-like structure in the MCXC J0631.3−5610 (z = 0.054) cluster field. Left: smoothed archival XMM-Newton 0.2−12 keV count image of the cluster, with white contours at levels of 0.3, 0.5, 0.9, and 1.7 counts per pixel. The position of the relic-like source relative to the cluster region is indicated, with filtered 25″ resolution MGCLS contours of the radio source, to the west, in black; the radio source appears to be 1.5 Mpc from the cluster centre. Middle: multi-resolution MGCLS image of the radio source (yellow – 7.6″ × 7.5″ resolution; blue – filtered 25″ resolution), with cyan contours from the filtered 25″ resolution image (levels: 20, 40, 60, 80 μJy beam−1). The colour scale is in square root scaling between 8−200 μJy beam−1 (yellow) and 5−300 μJy beam−1 (blue). The physical scale at the cluster redshift is shown in the upper right corner, and the synthesised MGCLS beams in the lower left corner. Right: DSS r-band image of the same region as the middle panel. Cyan contours are the same as in the left inset, and black contours are from the 15″ resolution MGCLS image with levels of 3, 6, 10, 20 × 1σ, where σ = 10 μJy beam−1. The synthesised MGCLS beams are shown in the lower left corner. There appears to be no obvious optical counterpart for the radio source.
Current usage metrics show cumulative count of Article Views (full-text article views including HTML views, PDF and ePub downloads, according to the available data) and Abstracts Views on Vision4Press platform.
Data correspond to usage on the plateform after 2015. The current usage metrics is available 48-96 hours after online publication and is updated daily on week days.
Initial download of the metrics may take a while.