Fig. 11.
Download original image
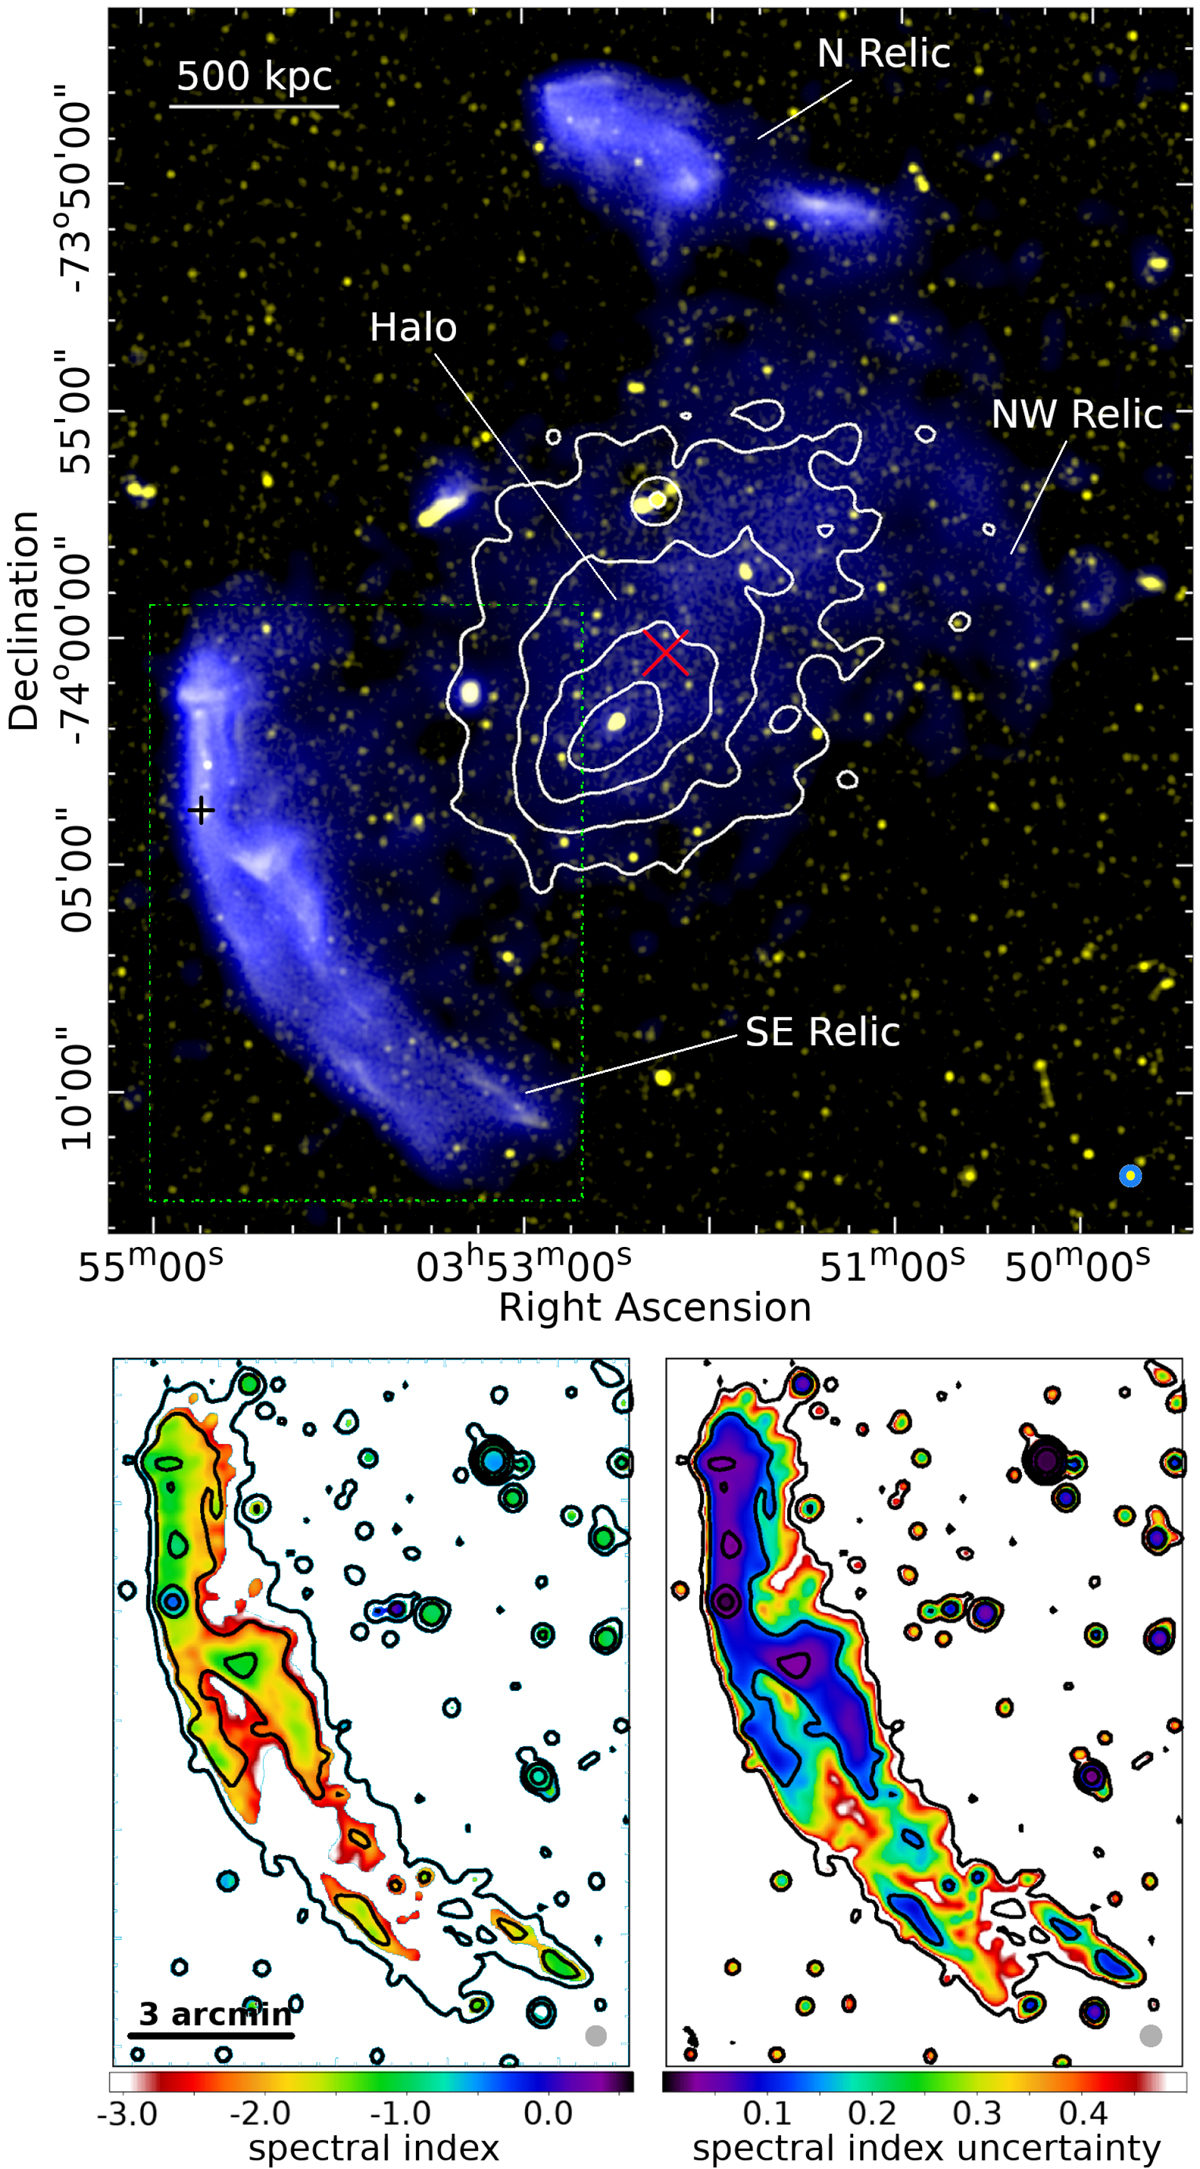
MGCLS view of the newly detected multiple-relic and radio halo system in MCXC J0352.4−7401. Top: MGCLS full-resolution (7.0″ × 6.8″; yellow) and filtered 25″ resolution (blue) Stokes-I intensity images. The colour scales are in square root scaling between 50−500 μJy beam−1 (yellow) and 5−300 μJy beam−1 (blue). Synthesised MGCLS beams are shown on the lower right, and the physical scale at the cluster redshift is shown on the upper left. The red × marks the NED cluster position, and the black cross indicates the position of a 3 mJy compact source coincident with the SE relic. Smoothed archival Chandra 0.5−7 keV contours (levels: 4, 8, 16, 30 × 10−7 counts cm−2 s−1) are overlaid in white. Bottom: in-band spectral index (left) and spectral index uncertainty (right) maps of the dashed region from the top panel, with 15″ resolution MGCLS intensity contours overlaid. Contours start at 5σ = 40 μJy beam−1 and increase in factors of 4. The synthesised beam is indicated by the filled grey circle on the lower right of each panel.
Current usage metrics show cumulative count of Article Views (full-text article views including HTML views, PDF and ePub downloads, according to the available data) and Abstracts Views on Vision4Press platform.
Data correspond to usage on the plateform after 2015. The current usage metrics is available 48-96 hours after online publication and is updated daily on week days.
Initial download of the metrics may take a while.