Free Access
Fig. 5
Download original image
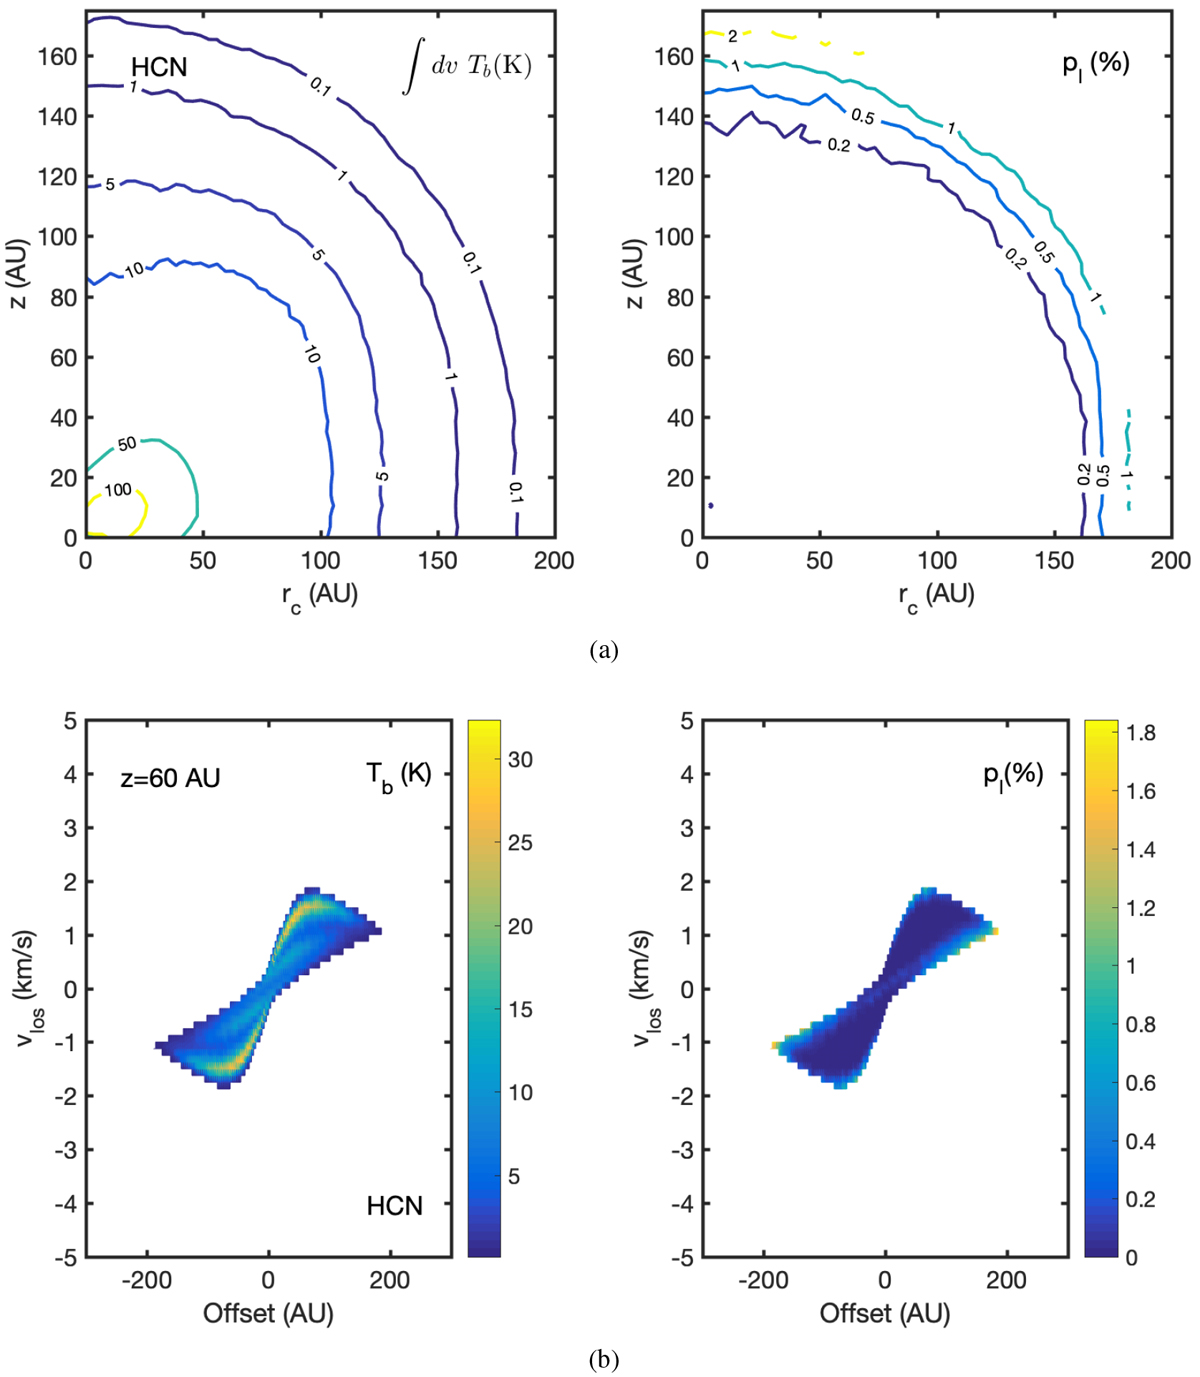
Integrated intensity maps (a) and position-velocity diagrams (b) of the HCN J = 4 → 3 transition. The PV diagram is taken at z = 60 au. On the left-hand side, we plotted the total intensity, and on the right-hand side, the associated polarization fraction is shown. The magnetic field has a toroidal morphology.
Current usage metrics show cumulative count of Article Views (full-text article views including HTML views, PDF and ePub downloads, according to the available data) and Abstracts Views on Vision4Press platform.
Data correspond to usage on the plateform after 2015. The current usage metrics is available 48-96 hours after online publication and is updated daily on week days.
Initial download of the metrics may take a while.