Fig. 9.
Download original image
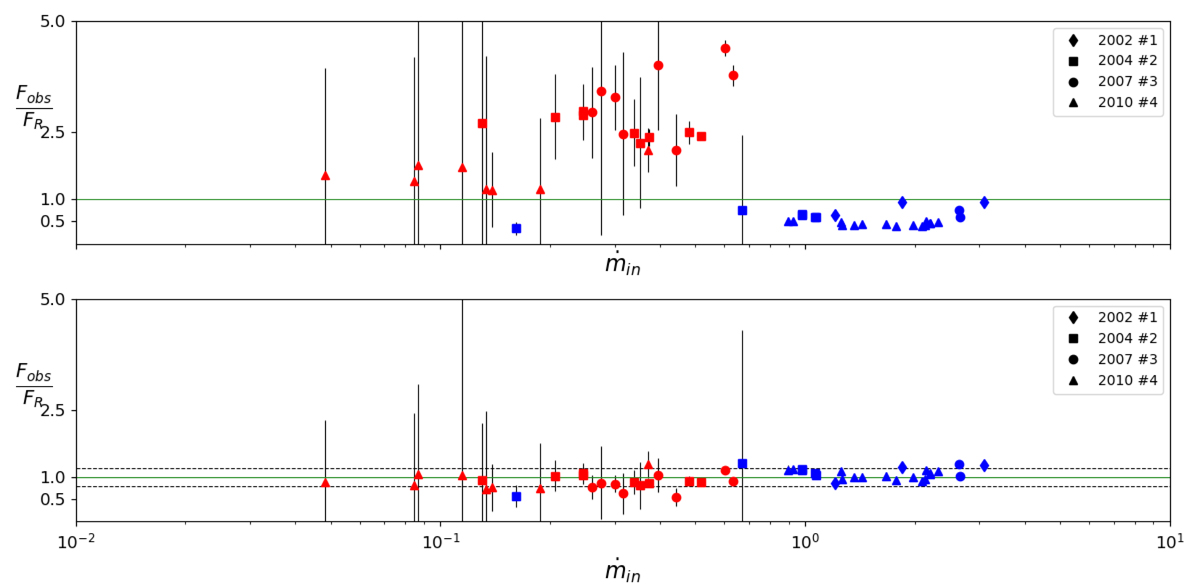
Ratios of the observed radio fluxes to the modeled radio fluxes for all the quasi-simultaneous radio–X-ray observations of the four outbursts. Each outburst is represented using a different symbol (see legend). In blue are shown the rising phases and in red the decaying phases. The modeled radio fluxes were obtained using Eq. (2). The parameters are (α = −0.67, β = 0.94) for the rising phases and (α = −0.15, β = 0.9) for the decaying phases. Top panel: ![]() used for all outbursts. Bottom panel: different
used for all outbursts. Bottom panel: different ![]() used for each phase of the outbursts. All values of
used for each phase of the outbursts. All values of ![]() used are reported in Table 3. The horizontal dashed lines represent a 20% error margin (ratio of 0.8 and 1.2, respectively).
used are reported in Table 3. The horizontal dashed lines represent a 20% error margin (ratio of 0.8 and 1.2, respectively).
Current usage metrics show cumulative count of Article Views (full-text article views including HTML views, PDF and ePub downloads, according to the available data) and Abstracts Views on Vision4Press platform.
Data correspond to usage on the plateform after 2015. The current usage metrics is available 48-96 hours after online publication and is updated daily on week days.
Initial download of the metrics may take a while.