Fig. 8.
Download original image
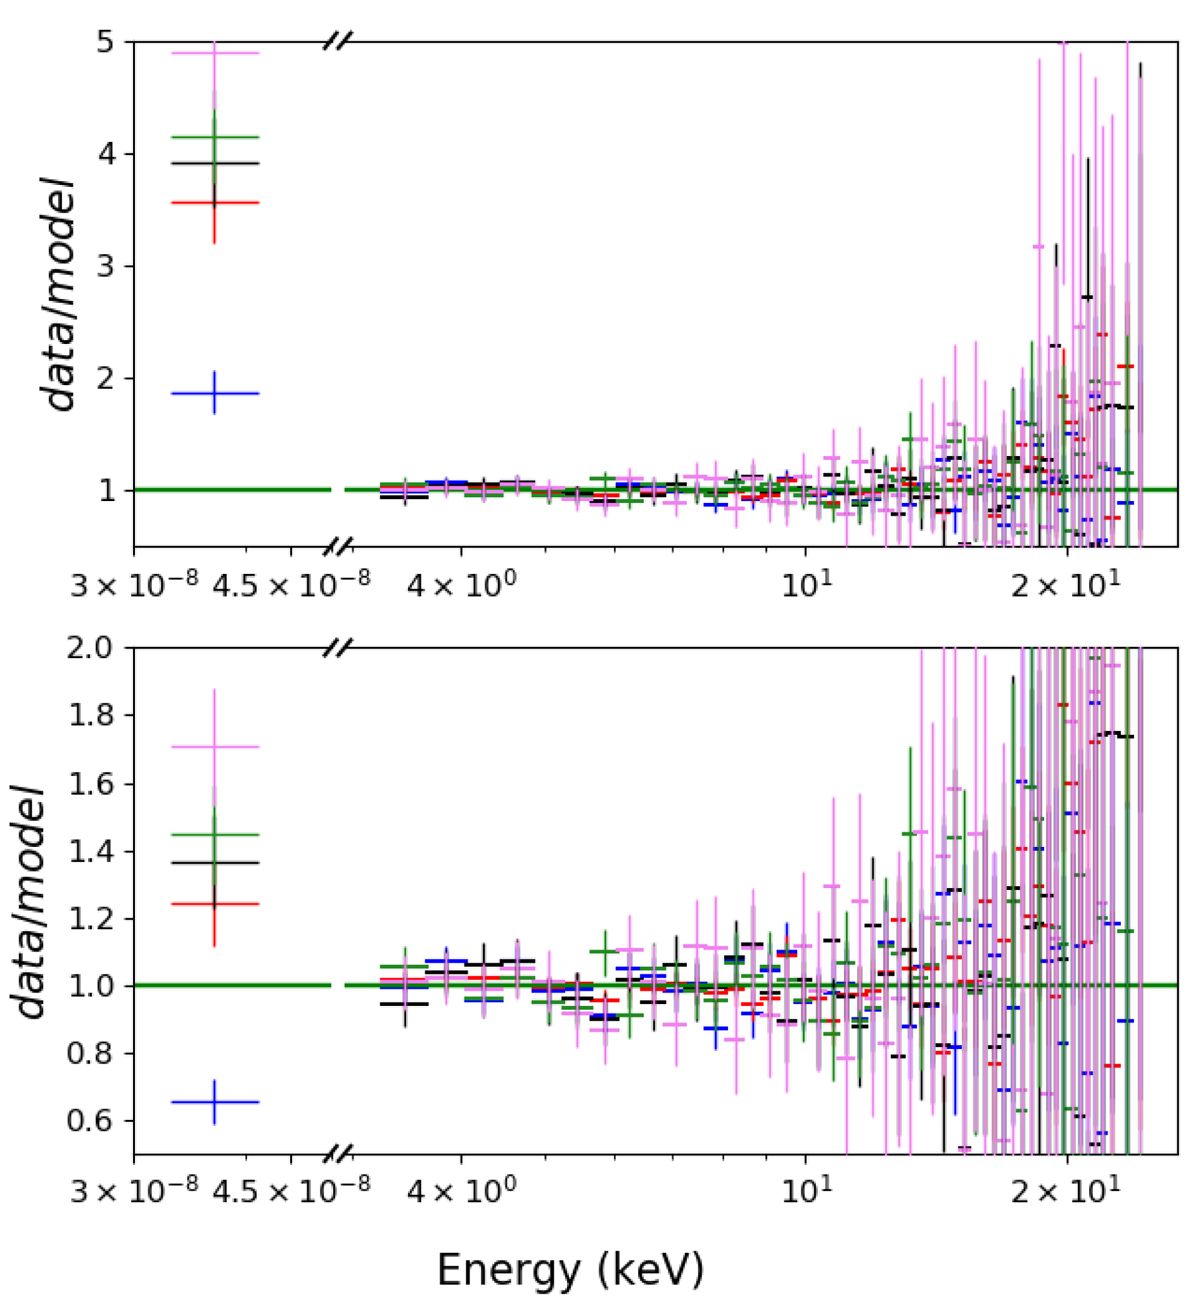
Ratio of the data to the model for the best fit of five of the eight multiwavelength observations of the decaying phase of outburst 4 (MJD 55613 in blue, 55617 in red, 55620 in black, 55630 in green, and 55639 in violet). Top panel: all fits were done simultaneously, fixing the parameters of Eq. (2) to those found in the rising phase: ![]() , α = −0.66, and β = 1.00. Bottom panel: fixing α and β to the values found for the rising phase,
, α = −0.66, and β = 1.00. Bottom panel: fixing α and β to the values found for the rising phase, ![]() is free to vary and converges to the value 2.0 × 10⁻⁷.
is free to vary and converges to the value 2.0 × 10⁻⁷.
Current usage metrics show cumulative count of Article Views (full-text article views including HTML views, PDF and ePub downloads, according to the available data) and Abstracts Views on Vision4Press platform.
Data correspond to usage on the plateform after 2015. The current usage metrics is available 48-96 hours after online publication and is updated daily on week days.
Initial download of the metrics may take a while.