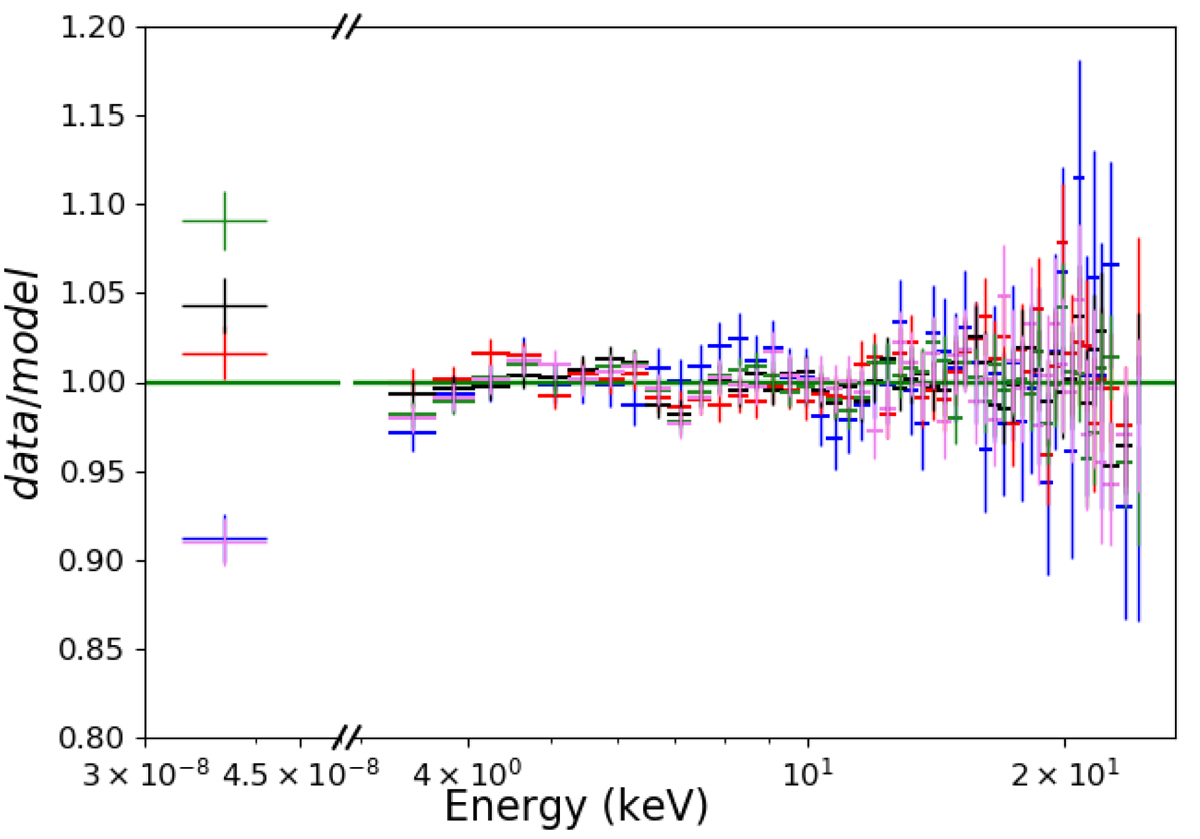
Fig. 6.
Download original image
Ratio of the data to the model for the best fit of 5 of the 16 multiwavelength observations (radio–X-ray) of the rising phase of the 2010 outburst (MJD 55217 in blue, 55259 in red, 55271 in black, 55288 in green, and 55292 in violet). Only five ratios are shown for purposes of visualization, but the best fit was obtained by using all the simultaneous or quasi-simultaneous radio–X-ray observation, fixing the JED-SAD parameters to the best fitting values obtained by fitting the X-ray spectra first, and then fitting the radio points with Eq. (2).
Current usage metrics show cumulative count of Article Views (full-text article views including HTML views, PDF and ePub downloads, according to the available data) and Abstracts Views on Vision4Press platform.
Data correspond to usage on the plateform after 2015. The current usage metrics is available 48-96 hours after online publication and is updated daily on week days.
Initial download of the metrics may take a while.