Fig. 5.
Download original image
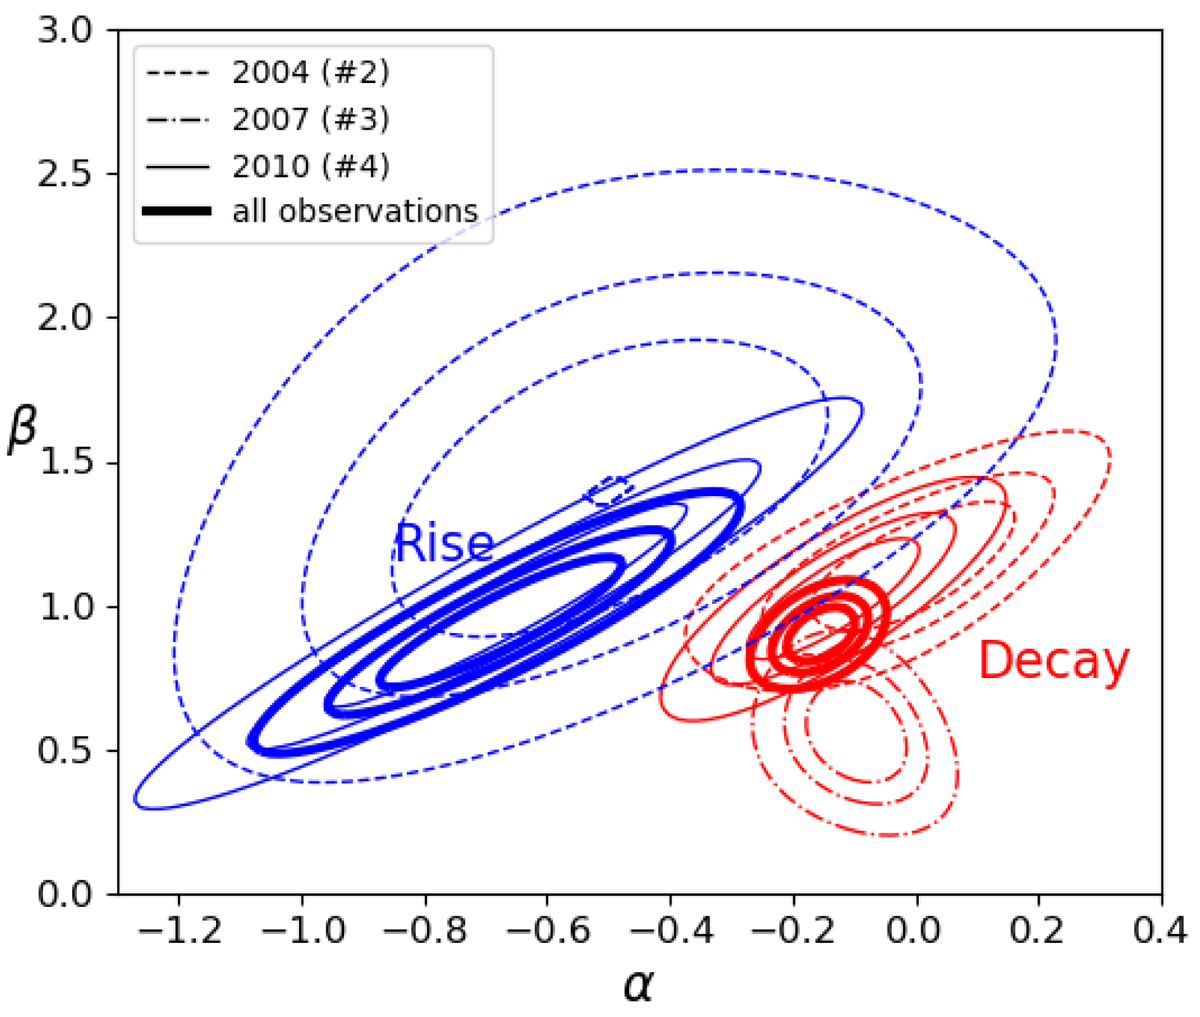
Contour plots β–α for the rising (blue) and decaying (red) phases of the outburst of 2004 (outburst 2, dashed line), 2007 (outburst 3, dot-dashed line), and 2010 (outburst 4, thin solid line). The contours in thick solid lines represent the dependency when fitting all rising (blue) or decaying (red) phase radio fluxes simultaneously. Confidence contour levels correspond to 68%, 90%, and 99% (Δχ2 of 2.3, 4.61, and 9.2, respectively). The contours are obtained when fitting only the quasi-simultaneous radio–X-ray observations (not the interpolated radio observations).
Current usage metrics show cumulative count of Article Views (full-text article views including HTML views, PDF and ePub downloads, according to the available data) and Abstracts Views on Vision4Press platform.
Data correspond to usage on the plateform after 2015. The current usage metrics is available 48-96 hours after online publication and is updated daily on week days.
Initial download of the metrics may take a while.