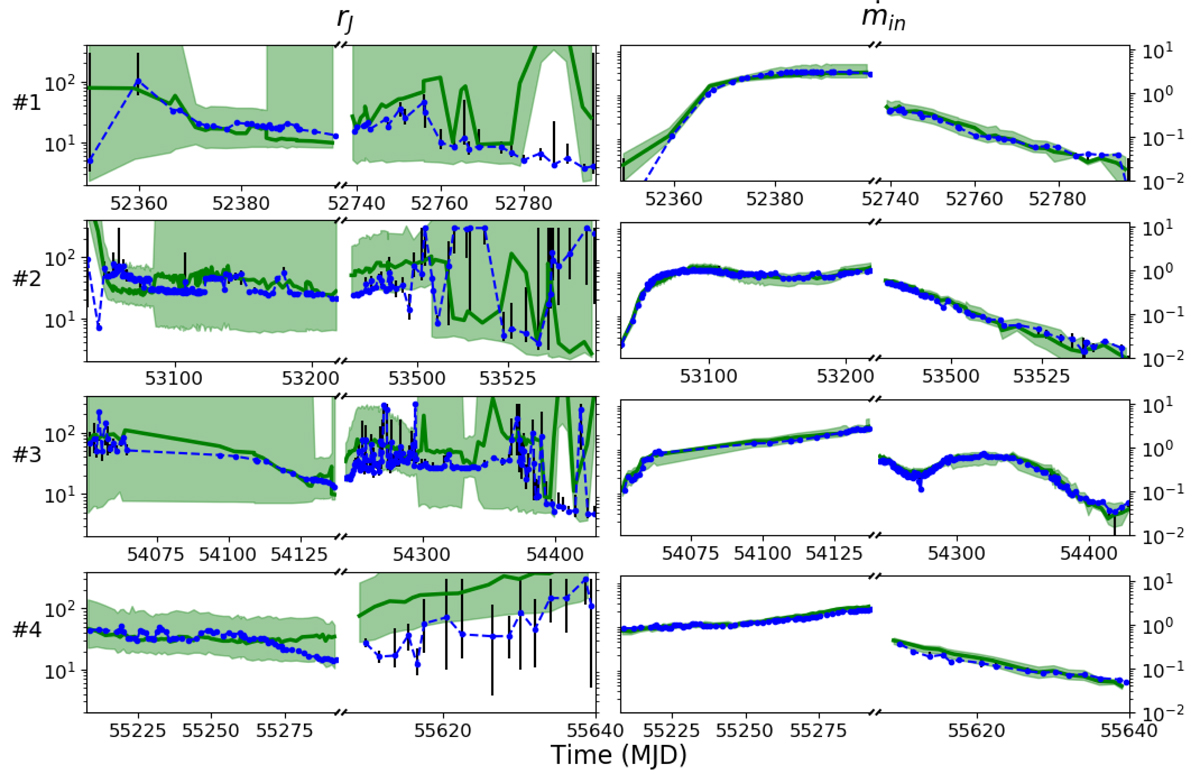
Fig. 3.
Download original image
Results of the fitting procedure. Left: transition radius rJ (from risco to 300) between the JED and the SAD. Right: mass accretion rate ṁin. Each side is divided vertically between the four outbursts and horizontally between the rising and decaying phase of each outburst. The green solid line represent the results from M19 and M20, and the green region indicates where the minimization function varies by less than 10% with respect to its minimum. The blue dashed line shows the results of the fitting procedure and the black vertical bar the associated 90% confidence range. The decaying phase of outburst 4 is the subject of Appendix B.
Current usage metrics show cumulative count of Article Views (full-text article views including HTML views, PDF and ePub downloads, according to the available data) and Abstracts Views on Vision4Press platform.
Data correspond to usage on the plateform after 2015. The current usage metrics is available 48-96 hours after online publication and is updated daily on week days.
Initial download of the metrics may take a while.