Fig. 2.
Download original image
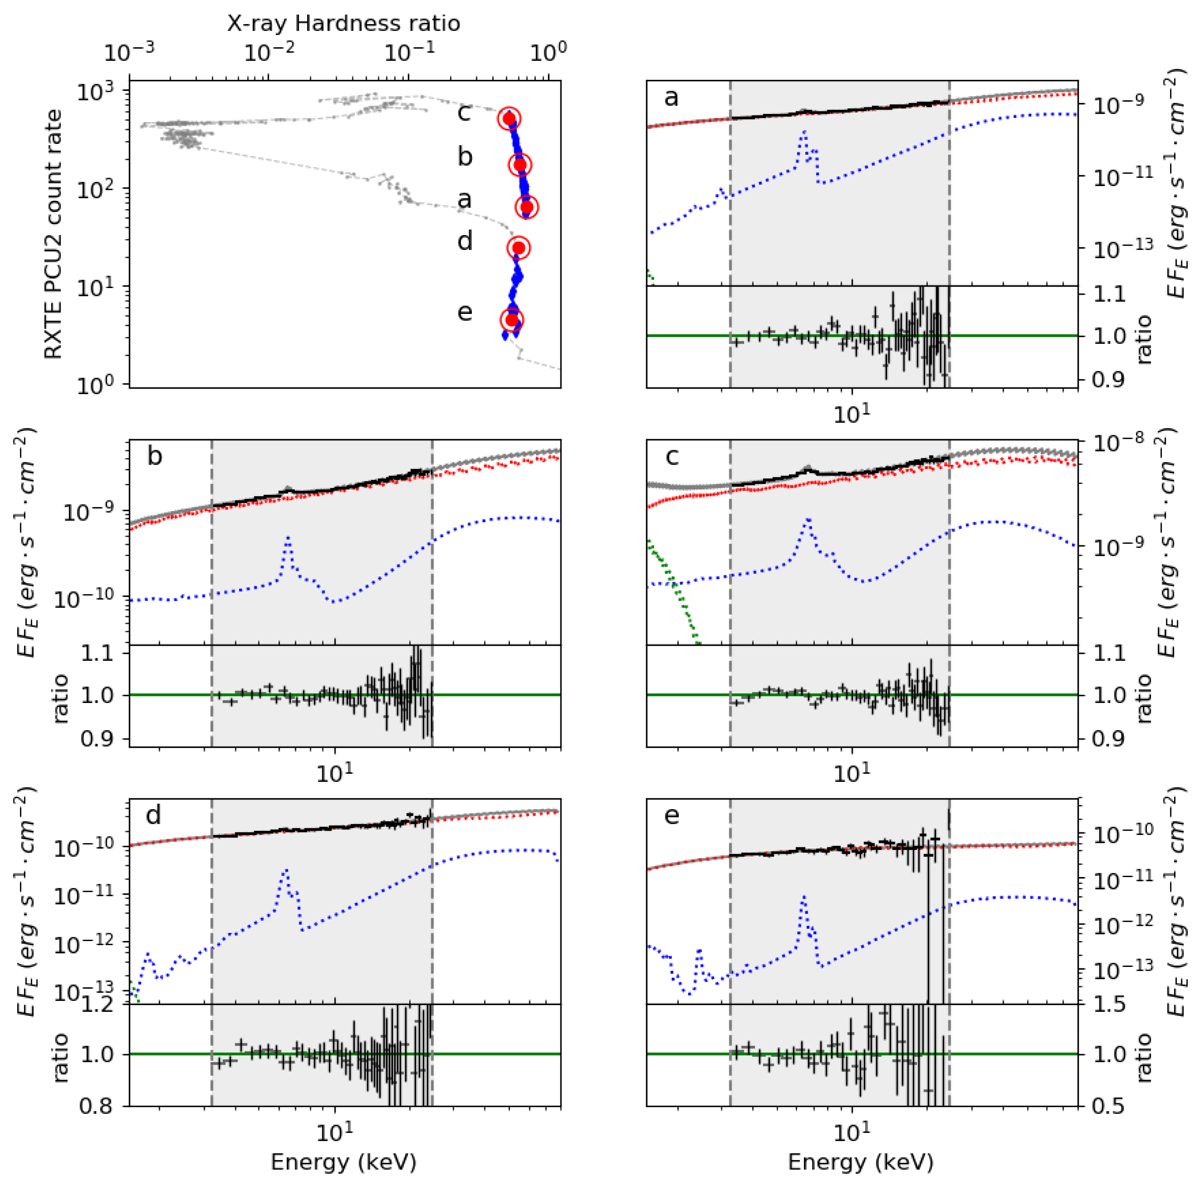
Best fits of some observations of outburst 4. Top left: hardness intensity diagram of outburst 4. The blue diamond shows the hard state used for this outburst. The five red points are the five observations plotted in the different figures from a to e. a–e: best fit spectra and the data/model ratio for the five observations indicated in red in the HID. The gray region shows the PCA energy range used for the fit. The data are in black and the best fit model in gray; the JED spectrum is in red, the SAD spectrum in green, and the reflection component in blue. The best fit parameters for each observation are listed in Table 2.
Current usage metrics show cumulative count of Article Views (full-text article views including HTML views, PDF and ePub downloads, according to the available data) and Abstracts Views on Vision4Press platform.
Data correspond to usage on the plateform after 2015. The current usage metrics is available 48-96 hours after online publication and is updated daily on week days.
Initial download of the metrics may take a while.