Open Access
Fig. C.1.
Download original image
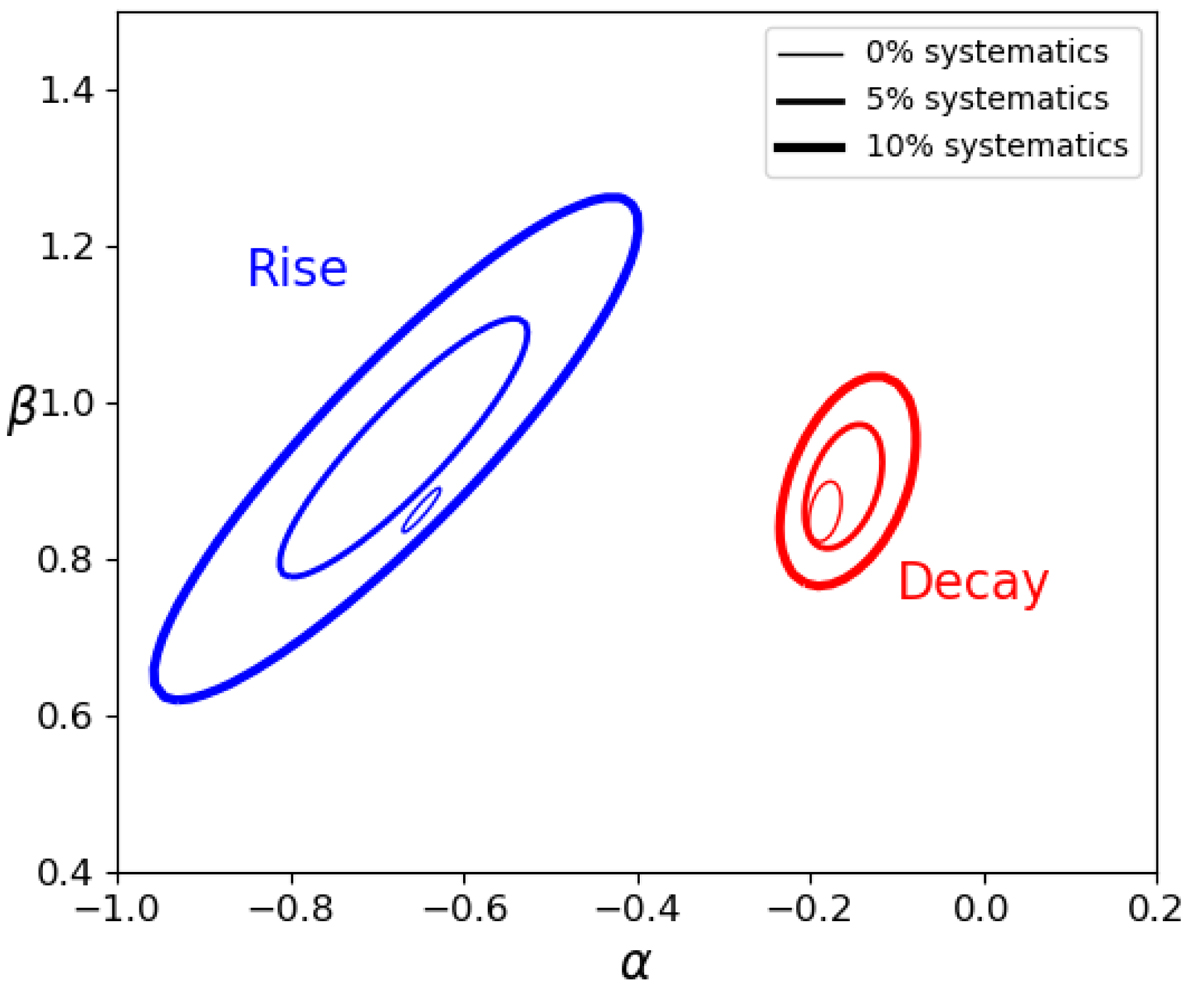
90% Confidence contours β–α for different values of systematic error added to the radio fluxes (0%, 5%, and 10%). The thicker the line, the larger the systematic error added. Shown are the contours for all the rising phase observations (in blue) and the contours for all the decaying phase observations (in red).
Current usage metrics show cumulative count of Article Views (full-text article views including HTML views, PDF and ePub downloads, according to the available data) and Abstracts Views on Vision4Press platform.
Data correspond to usage on the plateform after 2015. The current usage metrics is available 48-96 hours after online publication and is updated daily on week days.
Initial download of the metrics may take a while.