Fig. B.2.
Download original image
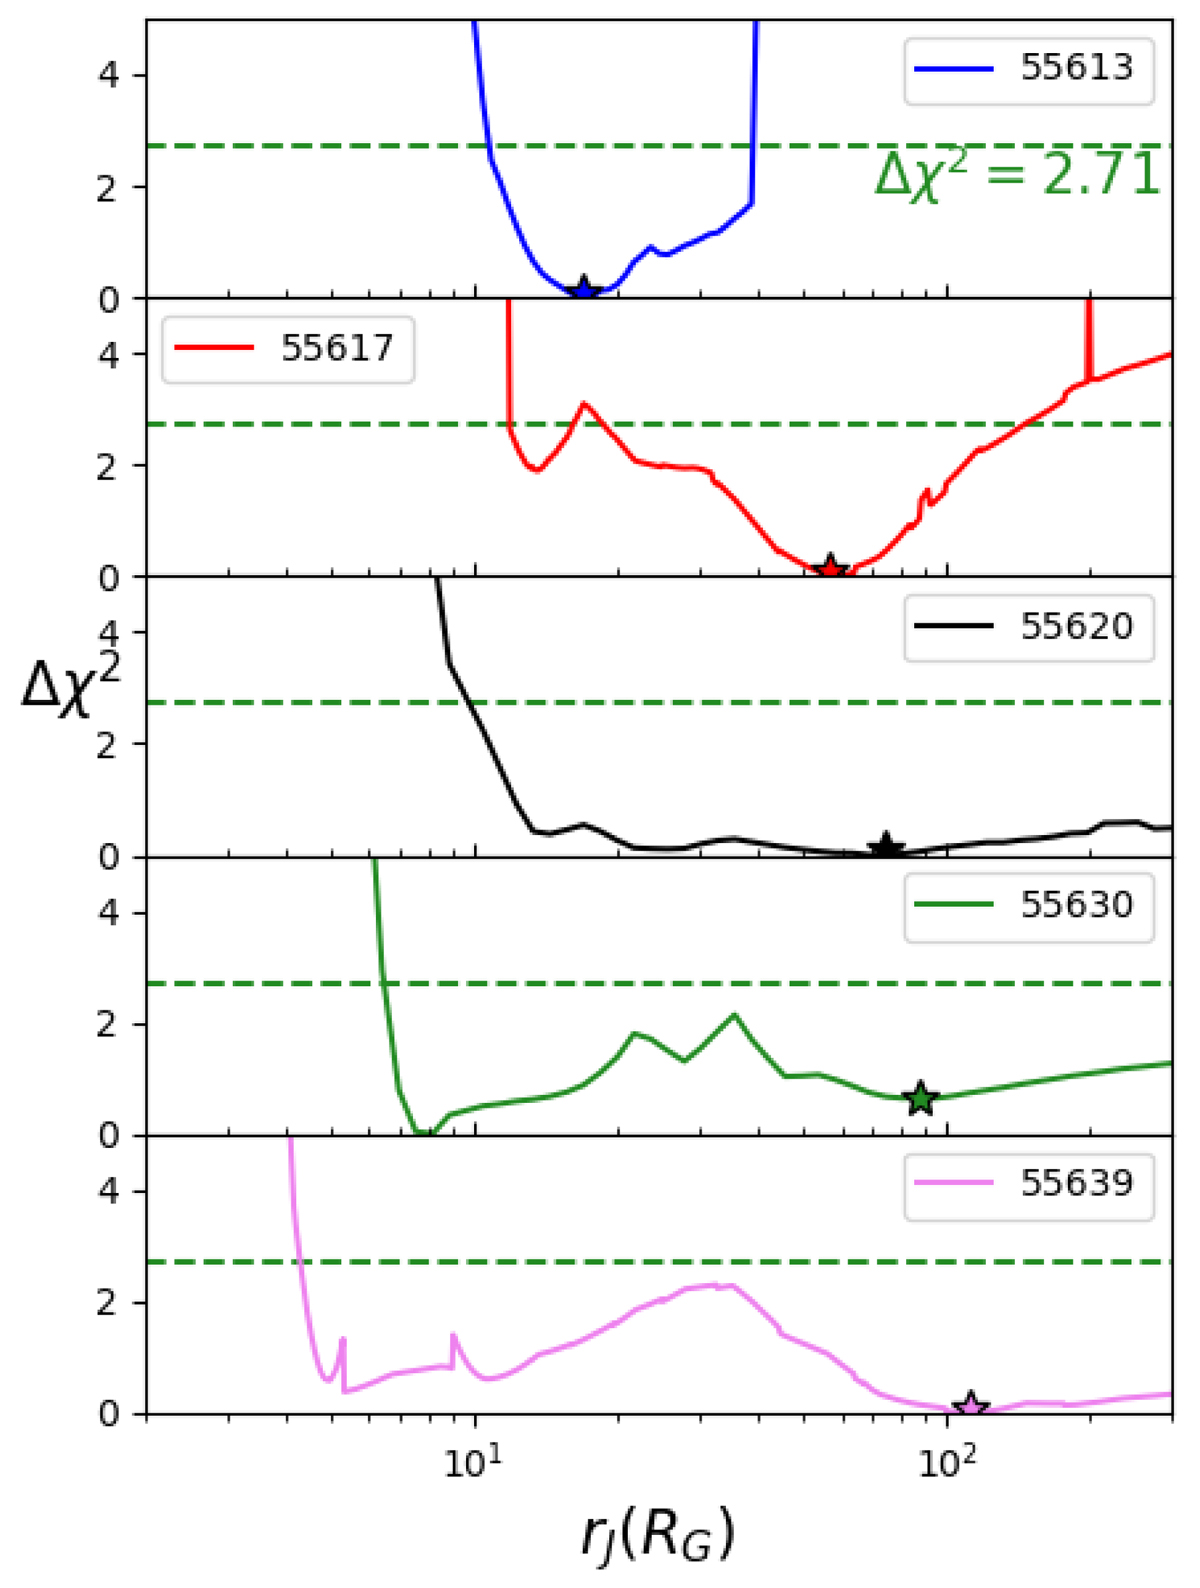
Evolution of the ![]() with rJ for a few observations from the decaying phase of outburst 4. From top to bottom in chronological order: MJD 55613, 55617, 55620, 55630, 55639. The 90% confidence threshold Δχ2 = 2.71 is shown as a dashed green horizontal line. We indicate with a star the solutions with higher values of rJ (plotted in red in Figs. 3 and B.1).
with rJ for a few observations from the decaying phase of outburst 4. From top to bottom in chronological order: MJD 55613, 55617, 55620, 55630, 55639. The 90% confidence threshold Δχ2 = 2.71 is shown as a dashed green horizontal line. We indicate with a star the solutions with higher values of rJ (plotted in red in Figs. 3 and B.1).
Current usage metrics show cumulative count of Article Views (full-text article views including HTML views, PDF and ePub downloads, according to the available data) and Abstracts Views on Vision4Press platform.
Data correspond to usage on the plateform after 2015. The current usage metrics is available 48-96 hours after online publication and is updated daily on week days.
Initial download of the metrics may take a while.