Open Access
Fig. A.1.
Download original image
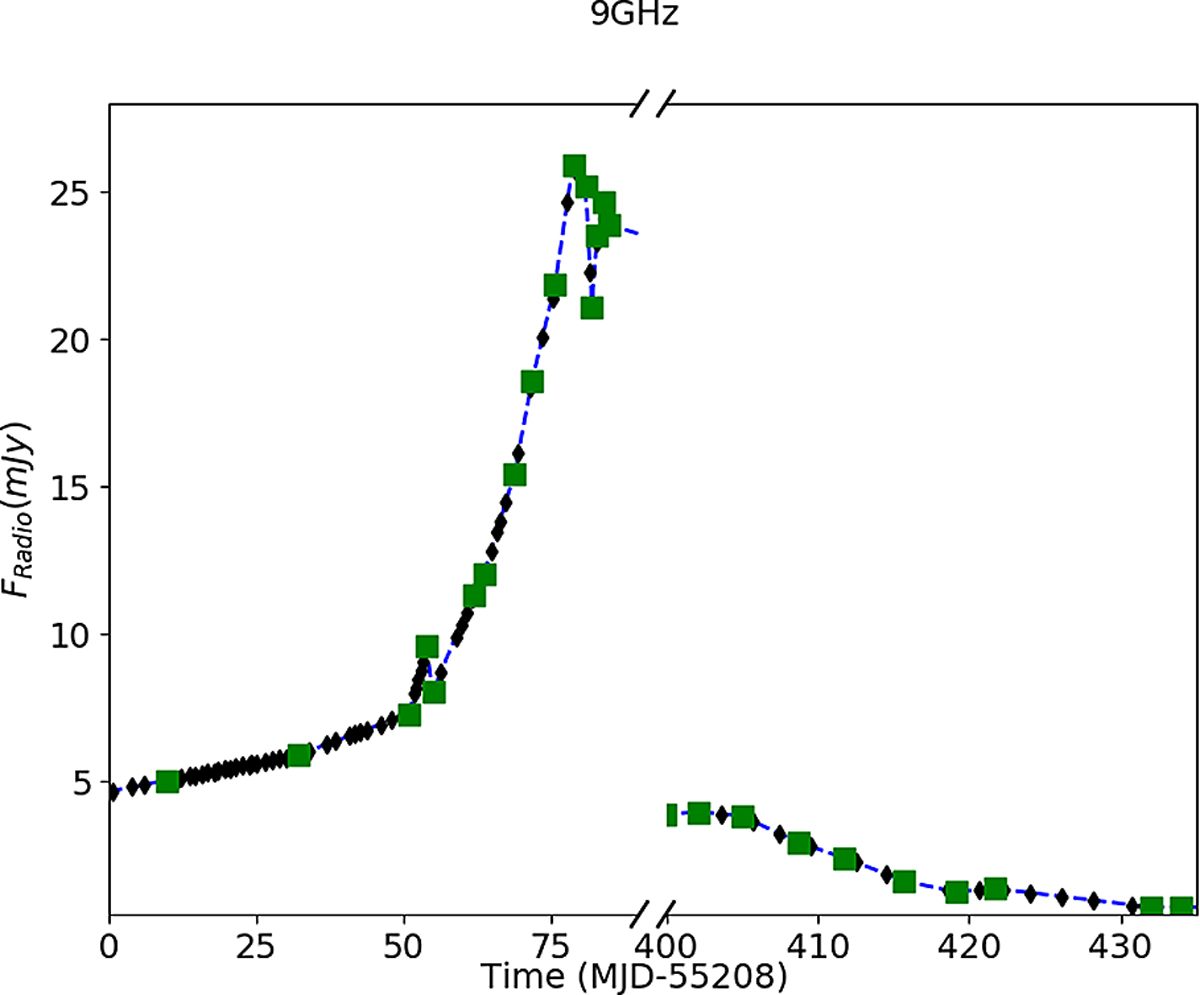
Radio light curve of outburst 4 during its hard states: between MJD 55208 and 55293, and between MJD 55608 and 55646. The green squares are the observed radio data. The blue dashed line is the linearly interpolated function. The black diamonds are the interpolated radio fluxes at the date of the X-ray observations.
Current usage metrics show cumulative count of Article Views (full-text article views including HTML views, PDF and ePub downloads, according to the available data) and Abstracts Views on Vision4Press platform.
Data correspond to usage on the plateform after 2015. The current usage metrics is available 48-96 hours after online publication and is updated daily on week days.
Initial download of the metrics may take a while.