Fig. 11.
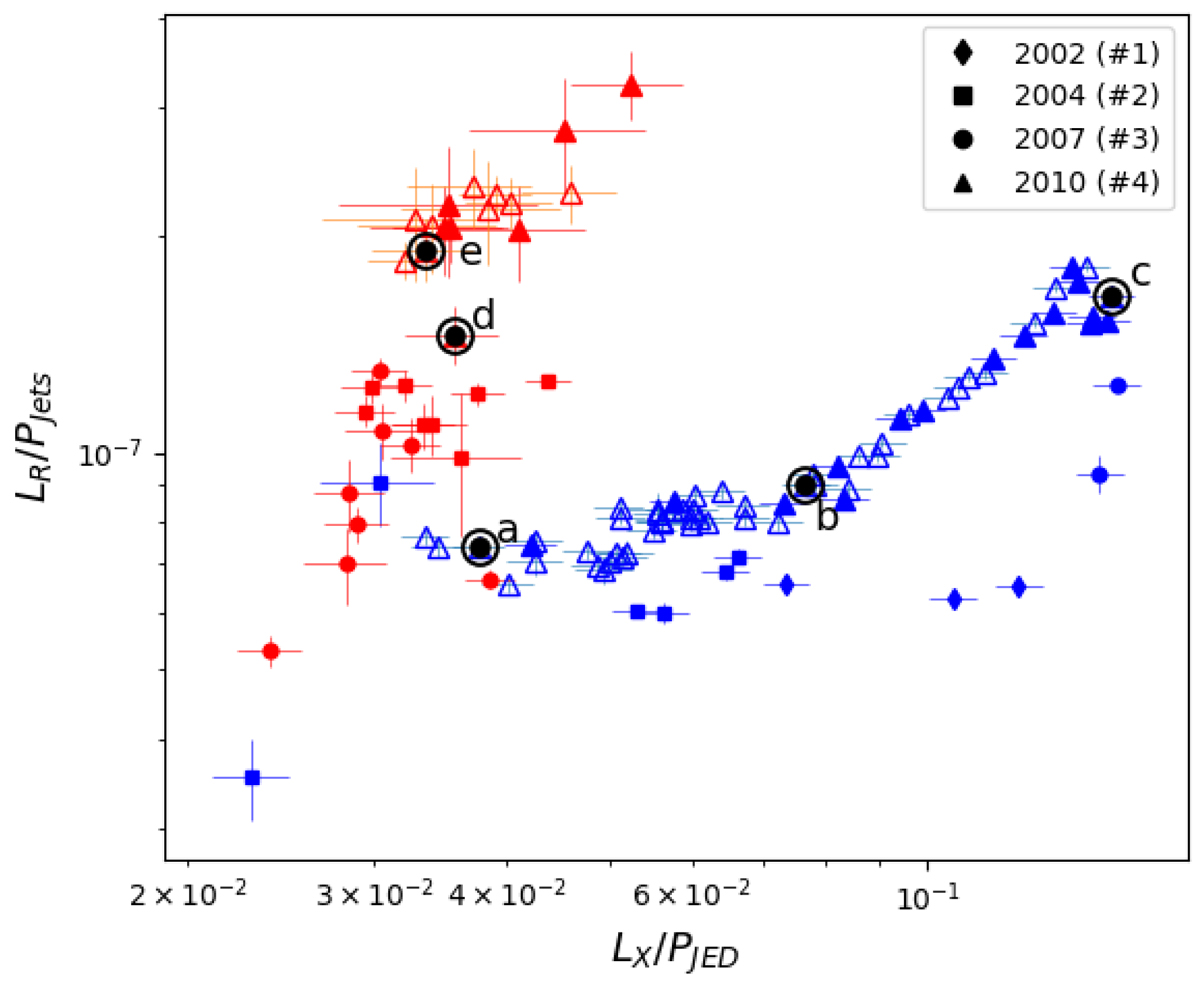
Download original image
Radio emission efficiency (LR = L9 GHz/PJets) vs. X-ray emission efficiency (LX = L3 − 9 keV/PJED) during the outbursts of GX339-4. The blue points are the rising phases. The red points are the decaying phases. The symbols distinguish the different outbursts: diamonds for 2002, squares for 2004, dots for 2007, and triangles for 2010 (filled for the quasi-simultaneous observations and empty for the interpolated radio fluxes). We highlighted the five observations (labeled a to e) presented in Fig. 2 to provide the chronological evolution of an outburst.
Current usage metrics show cumulative count of Article Views (full-text article views including HTML views, PDF and ePub downloads, according to the available data) and Abstracts Views on Vision4Press platform.
Data correspond to usage on the plateform after 2015. The current usage metrics is available 48-96 hours after online publication and is updated daily on week days.
Initial download of the metrics may take a while.