Fig. 1.
Download original image
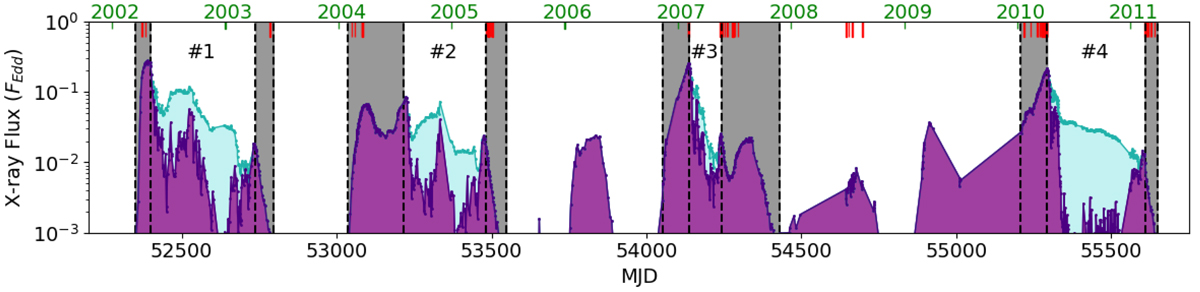
GX 339-4 X-ray light curve in the 3–200 keV energy band of the 2000–2010 decade obtained with the Clavel et al. (2016) fits. The violet filled region shows the power law unabsorbed flux, while the cyan region represents the disk unabsorbed flux. The selected spectra for this study are highlighted in gray: the rising and decaying hard states of the four outbursts (1, 2, 3, and 4). At the top the red lines represent the date when steady radio fluxes were observed at 9 GHz (from Corbel et al. 2013).
Current usage metrics show cumulative count of Article Views (full-text article views including HTML views, PDF and ePub downloads, according to the available data) and Abstracts Views on Vision4Press platform.
Data correspond to usage on the plateform after 2015. The current usage metrics is available 48-96 hours after online publication and is updated daily on week days.
Initial download of the metrics may take a while.