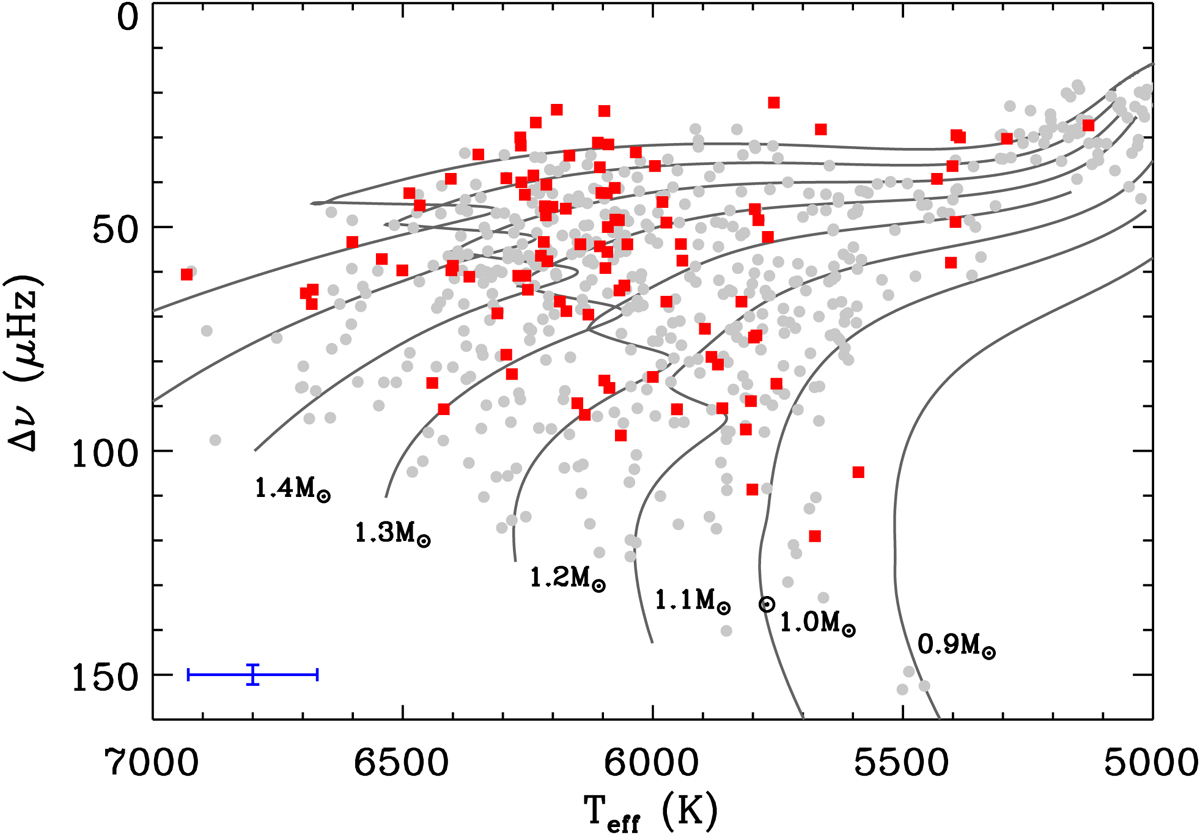
Fig. 2.
Download original image
Seismic Hertzsprung-Russell Diagram where the mean large frequency separation is used instead of the luminosity. The C14 solar-like stars are represented with grey circles where the effective temperature is taken from the M17. The 99 stars with confirmed seismic detections are shown with red squares where the effective temperature is coming from APOGEE, LAMOST or B20 (see Sect. 3.1). The position of the Sun is indicated by the ⊙ symbol and the grey solid lines represent evolution tracks from ASTEC (Christensen-Dalsgaard 2008) for a range of masses at solar composition (Z⊙ = 0.0246). Typical uncertainties are represented in the bottom left corner.
Current usage metrics show cumulative count of Article Views (full-text article views including HTML views, PDF and ePub downloads, according to the available data) and Abstracts Views on Vision4Press platform.
Data correspond to usage on the plateform after 2015. The current usage metrics is available 48-96 hours after online publication and is updated daily on week days.
Initial download of the metrics may take a while.