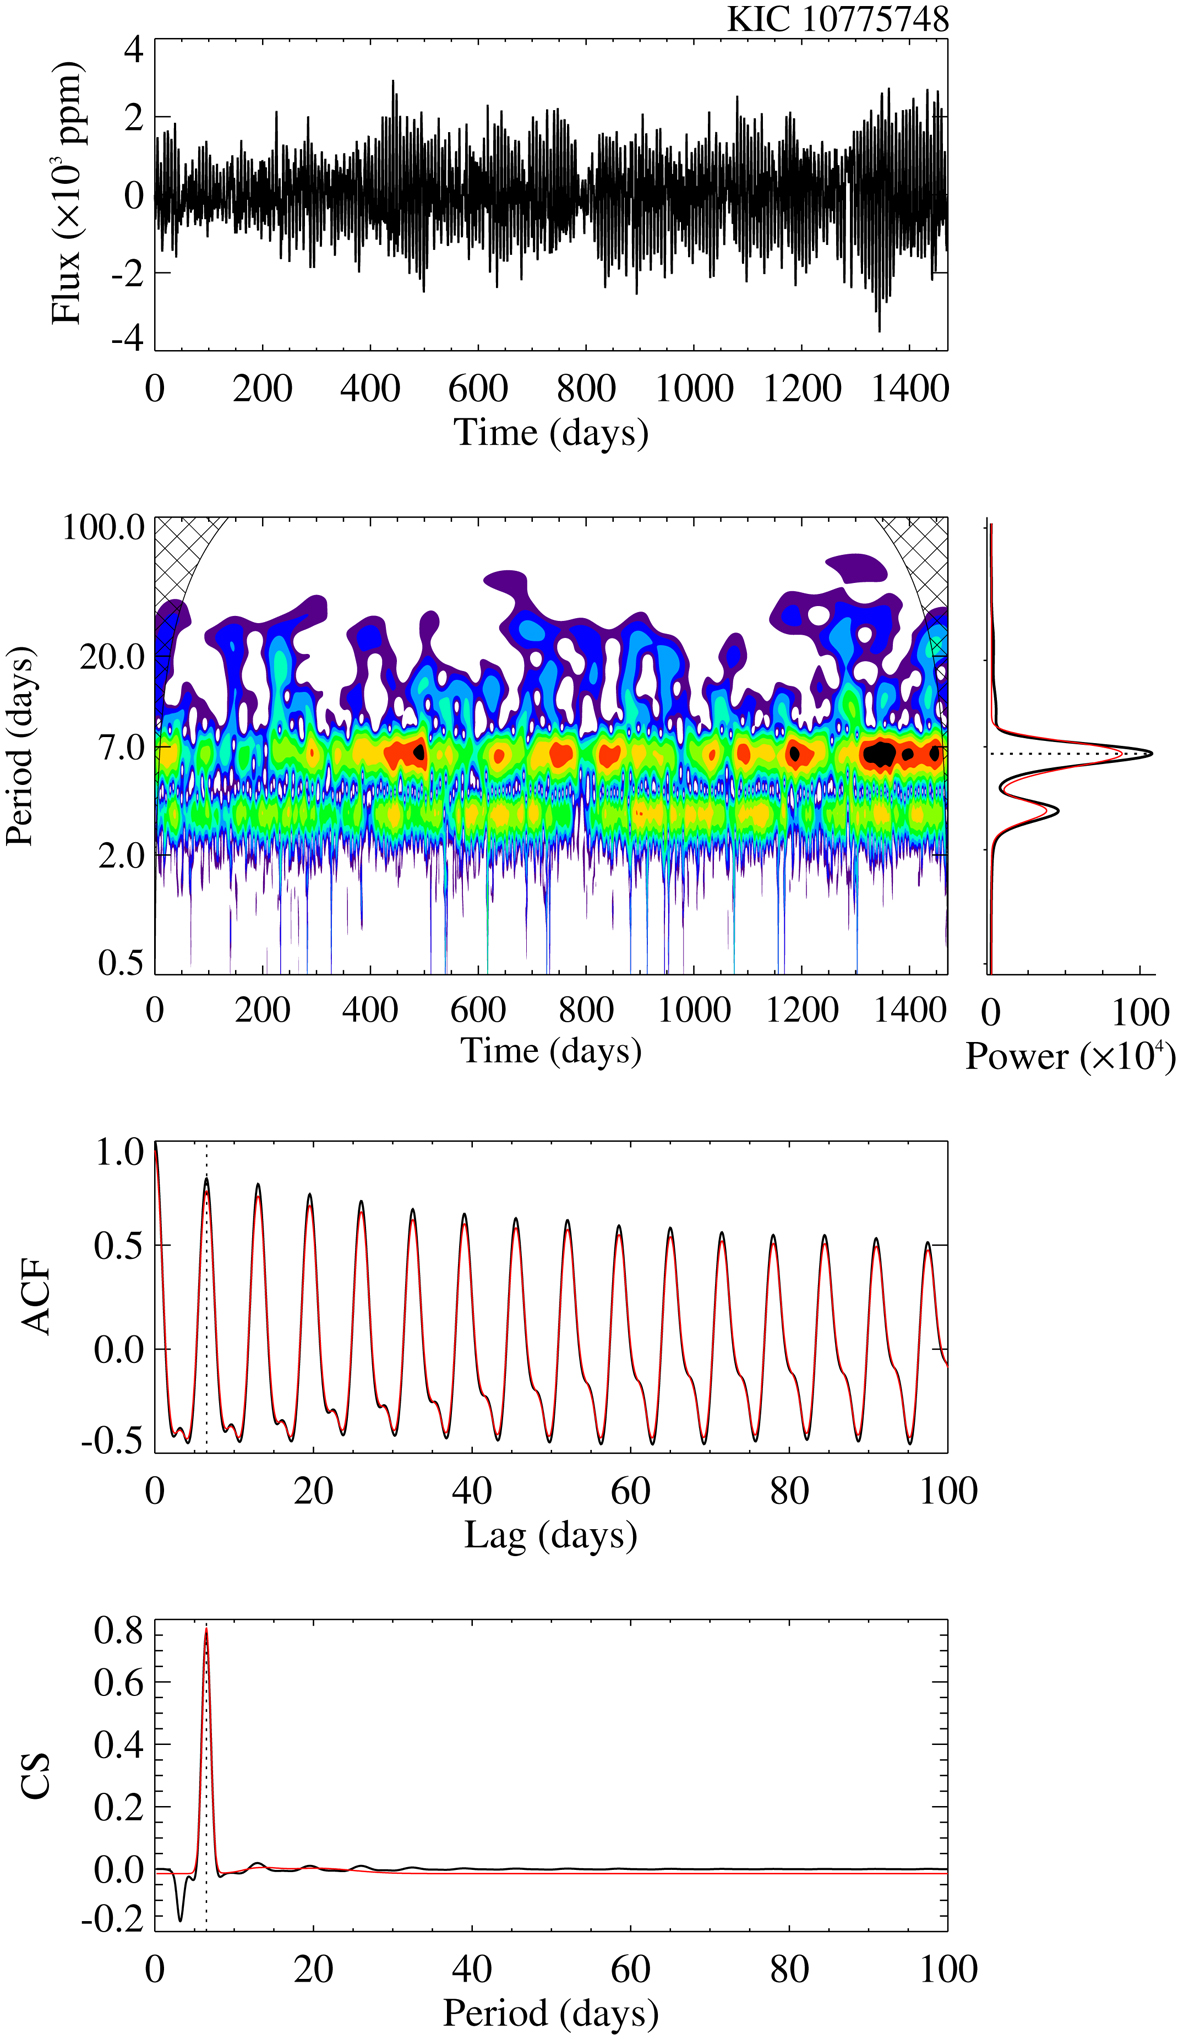
Fig. C.1.
Download original image
Surface rotation analysis of KIC 107775748. Top row: KEPSEISMIC light curve for KIC 10775748. Second row: Wavelet power spectrum (left), and global wavelet power spectrum (right; black), where the best fit with multiple Gaussian functions is shown in red. Third row: Autocorrelation function (ACF) of the light curve in black and its smoothed version in red. Bottom row: Composite spectrum (black) and best fit with multiple Gaussian functions (red). The dashed lines mark the rotation-period estimates from each diagnostic.
Current usage metrics show cumulative count of Article Views (full-text article views including HTML views, PDF and ePub downloads, according to the available data) and Abstracts Views on Vision4Press platform.
Data correspond to usage on the plateform after 2015. The current usage metrics is available 48-96 hours after online publication and is updated daily on week days.
Initial download of the metrics may take a while.