Free Access
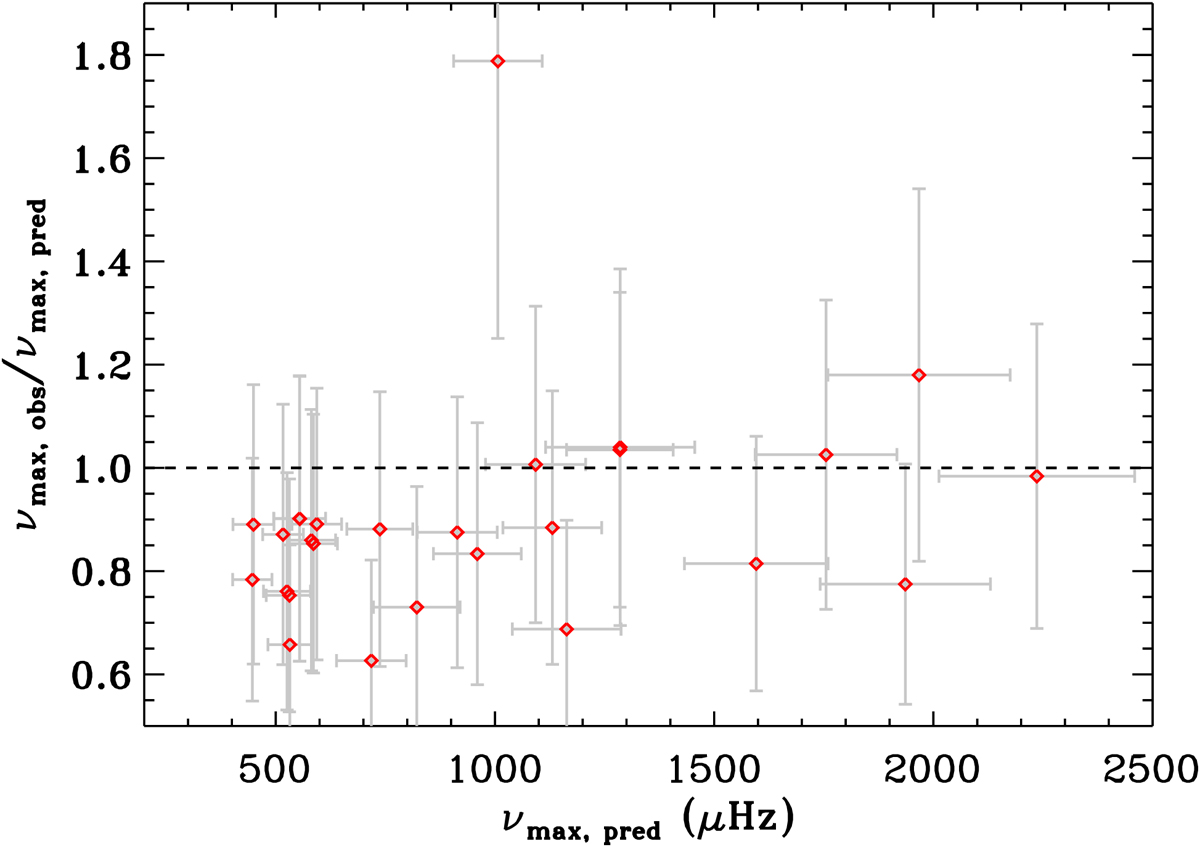
Fig. B.1.
Download original image
Ratio of the observed νmax, obs and the predicted νmax, pred using the log g from B20. Same details as in Figure 4 for the targets with possible detection of solar-like oscillations represented with red diamonds.
Current usage metrics show cumulative count of Article Views (full-text article views including HTML views, PDF and ePub downloads, according to the available data) and Abstracts Views on Vision4Press platform.
Data correspond to usage on the plateform after 2015. The current usage metrics is available 48-96 hours after online publication and is updated daily on week days.
Initial download of the metrics may take a while.