Fig. 13.
Download original image
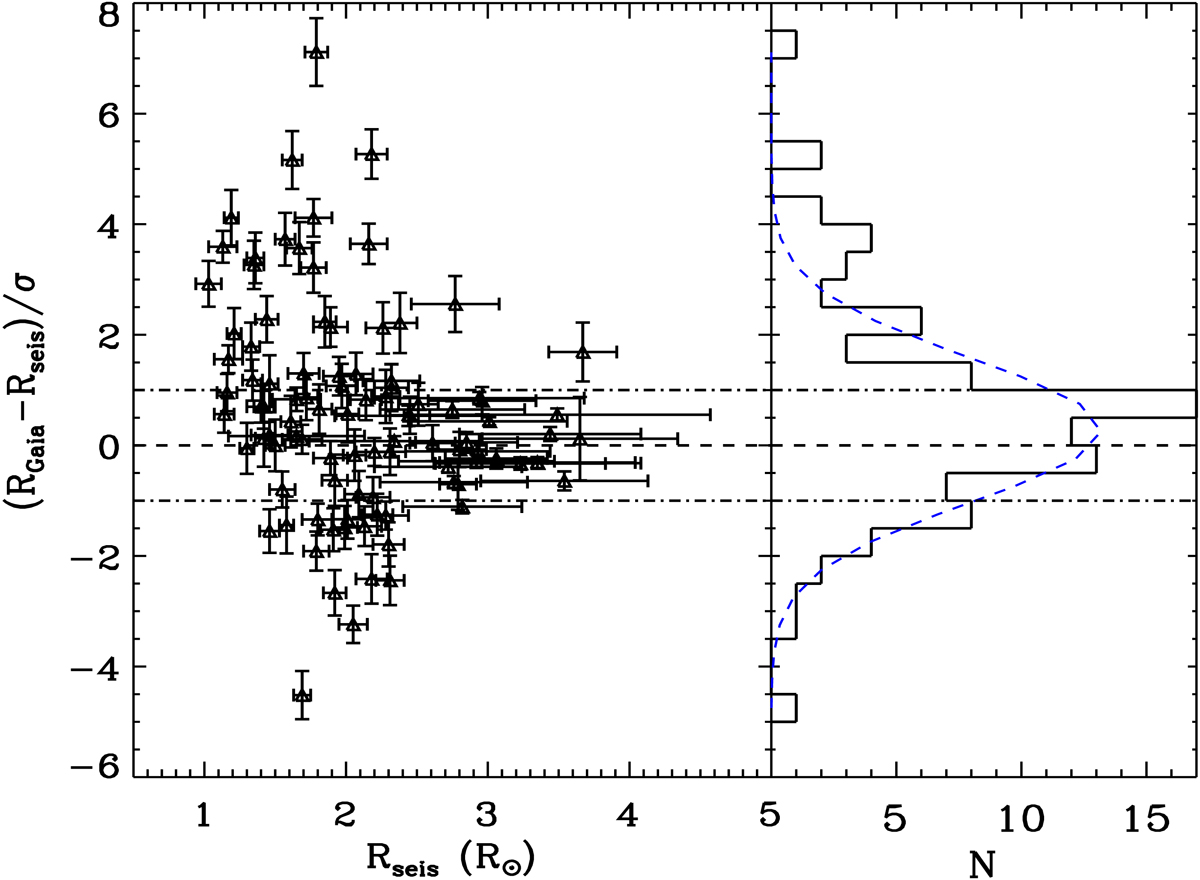
Left panel: Differences between the Gaia radius and the seismic radius in units of the statistical uncertainty (σ), computed as the quadratic sum of the uncertainties from the B20 radii and the scaling relations radii. Right panel: histogram of the same differences. Dashed lines show the equality of both radii and the dot-dash lines represent the ±1σ limits. Only 97 stars are shown as two targets do not have a Gaia radius. The blue dashed line shows a Gaussian fit of the histogram.
Current usage metrics show cumulative count of Article Views (full-text article views including HTML views, PDF and ePub downloads, according to the available data) and Abstracts Views on Vision4Press platform.
Data correspond to usage on the plateform after 2015. The current usage metrics is available 48-96 hours after online publication and is updated daily on week days.
Initial download of the metrics may take a while.