Fig. 12.
Download original image
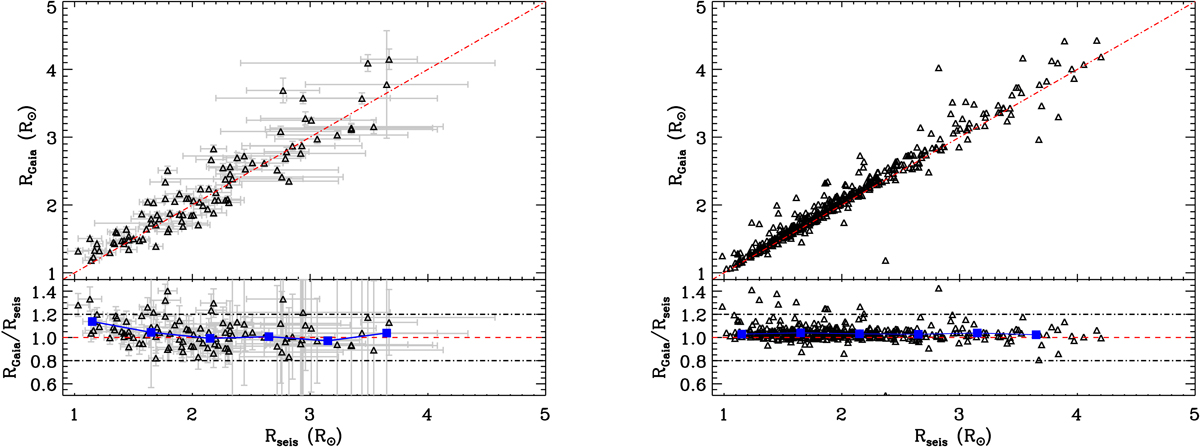
Left panel: comparison between the seismic radii after applying the Mosser et al. (2013) corrections on Δν and the Gaia radii (top panel) and ratio of the radii for our sample (bottom panel). The blue squares represent the median binned data. Only 97 stars are shown as two targets do not have a Gaia radius. Right panel: same details but for the S17 sample.
Current usage metrics show cumulative count of Article Views (full-text article views including HTML views, PDF and ePub downloads, according to the available data) and Abstracts Views on Vision4Press platform.
Data correspond to usage on the plateform after 2015. The current usage metrics is available 48-96 hours after online publication and is updated daily on week days.
Initial download of the metrics may take a while.