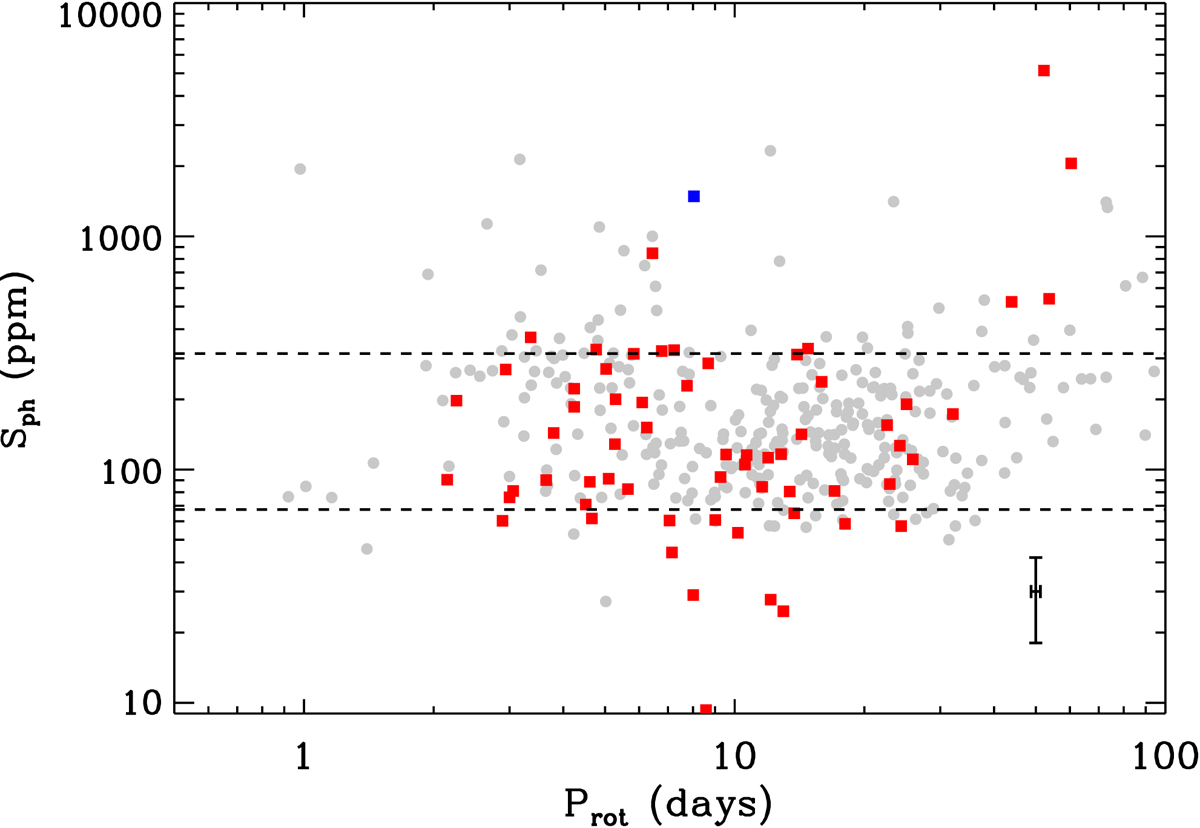
Fig. 11.
Download original image
Magnetic activity proxy, Sph vs surface rotation period, Prot for the G14 sample (grey circles) and our sample (squares). The blue square is the close binary candidate, KIC 4255487. The dashed lines correspond to the Sph values between minimum and maximum magnetic activity from Mathur et al. (2019). The typical error bars are represented in the bottom right-hand side.
Current usage metrics show cumulative count of Article Views (full-text article views including HTML views, PDF and ePub downloads, according to the available data) and Abstracts Views on Vision4Press platform.
Data correspond to usage on the plateform after 2015. The current usage metrics is available 48-96 hours after online publication and is updated daily on week days.
Initial download of the metrics may take a while.