Fig. 6.
Download original image
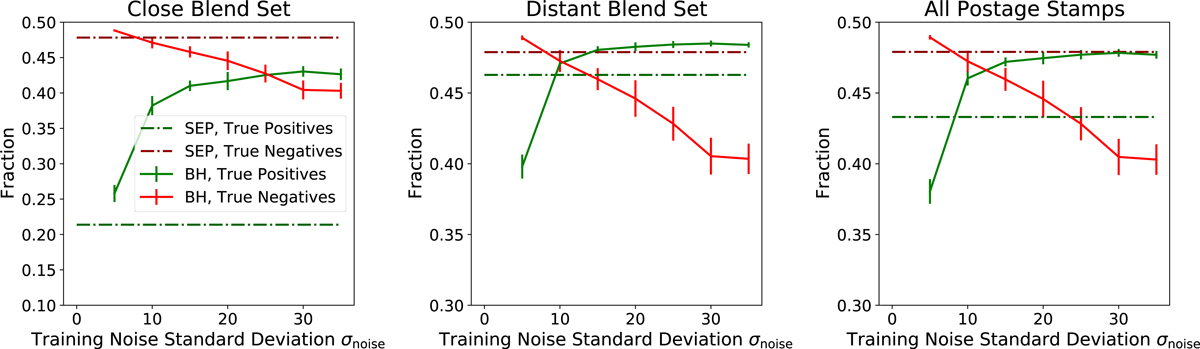
Classification confusion matrices of BLENDHUNTER (solid lines) compared to SEP (dot-dashed lines) for the realistic CFIS-like test data. Each panel shows the fraction of blends correctly classified as blends (i.e., true positives, green lines) or isolated sources correctly classified as isolated sources (i.e., true negatives, red lines) as a function of the training noise standard deviation. Left panel: sample of close blends along with an equivalent number of isolated sources. Middle panel: sample of distant blends along with the remaining isolated sources. Right panel: results for the full set of postage stamps.
Current usage metrics show cumulative count of Article Views (full-text article views including HTML views, PDF and ePub downloads, according to the available data) and Abstracts Views on Vision4Press platform.
Data correspond to usage on the plateform after 2015. The current usage metrics is available 48-96 hours after online publication and is updated daily on week days.
Initial download of the metrics may take a while.