Open Access
Fig. 1.
Download original image
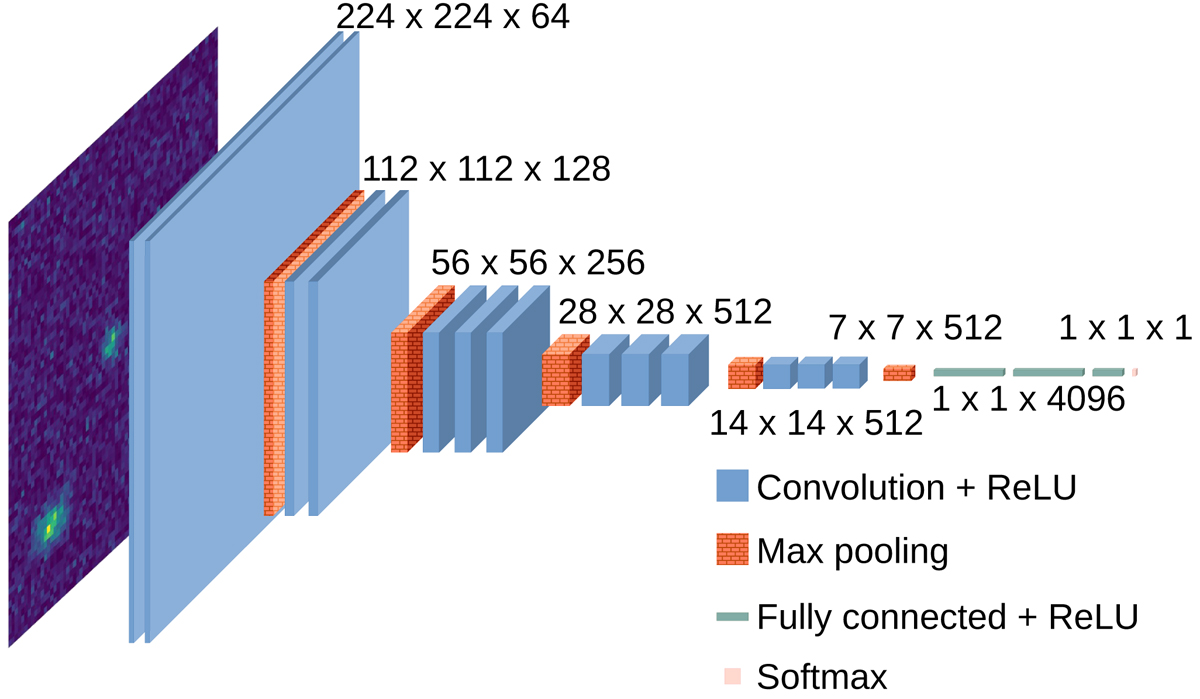
Visual representation of the VGG-16 network. Convolutional layers with ReLU activation are shown in solid blue, max pooling layers are shown in brick-pattern red, fully connected layers are shown as green bars, and the output softmax layer is shown as the last box in pink.
Current usage metrics show cumulative count of Article Views (full-text article views including HTML views, PDF and ePub downloads, according to the available data) and Abstracts Views on Vision4Press platform.
Data correspond to usage on the plateform after 2015. The current usage metrics is available 48-96 hours after online publication and is updated daily on week days.
Initial download of the metrics may take a while.