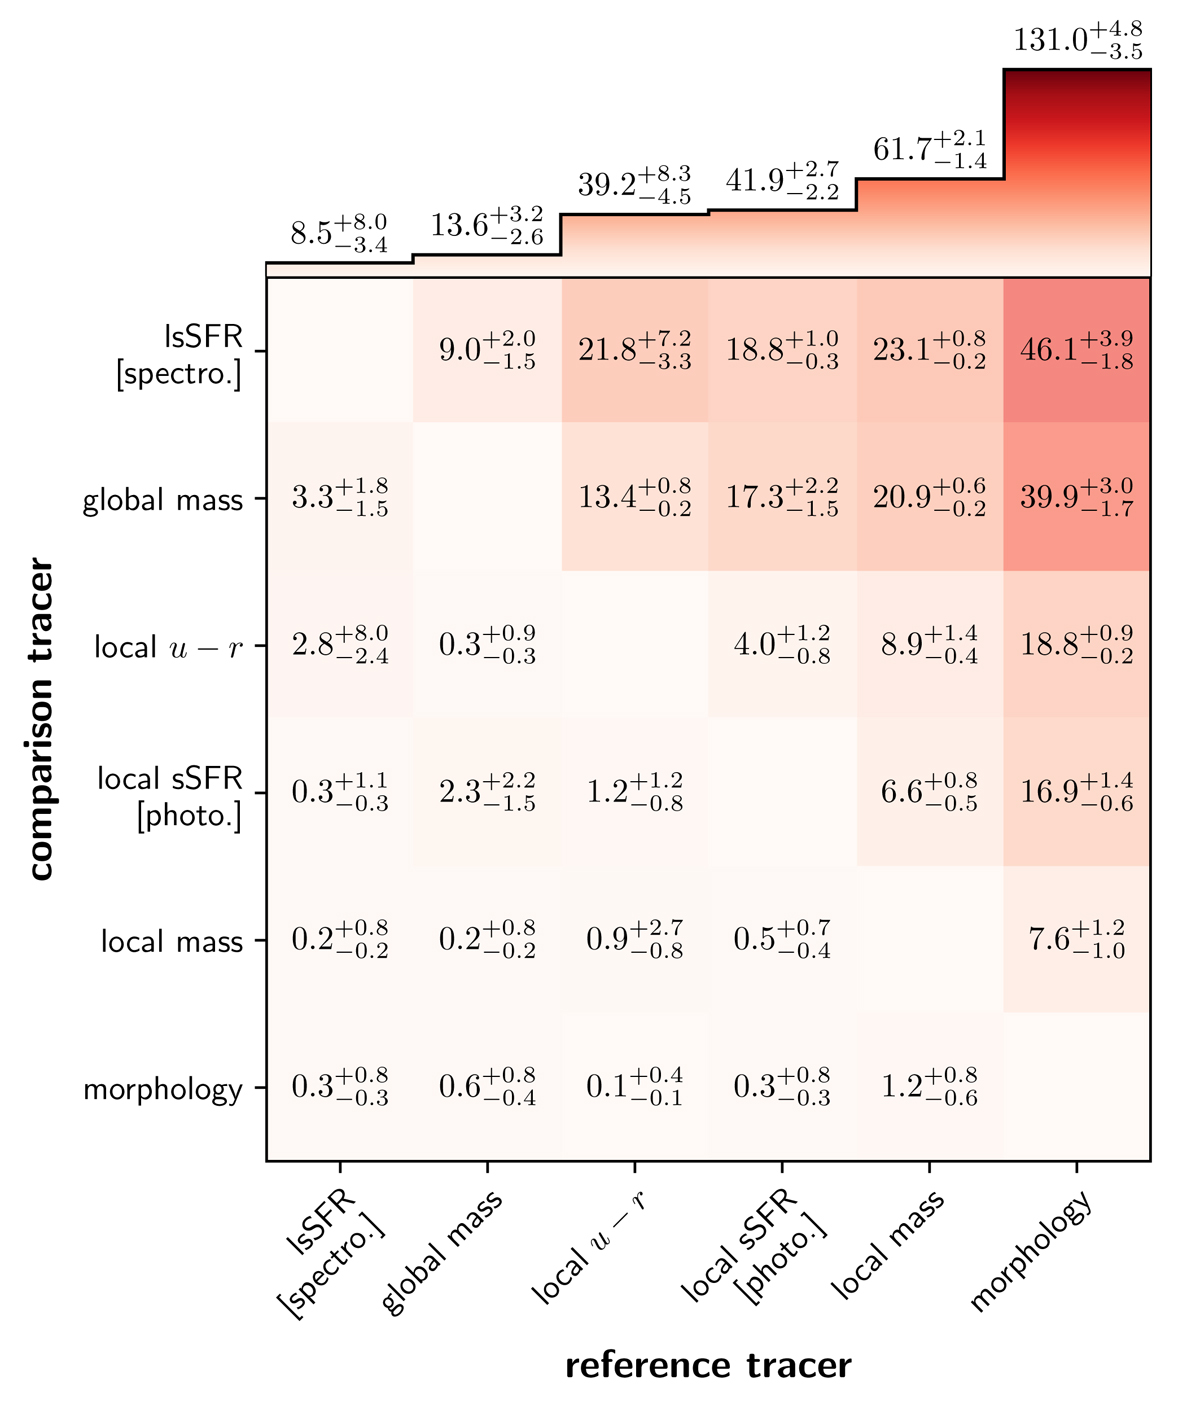
Fig. 6.
Download original image
Matrix reporting the median χ2 for each reference tracer (columns) and each comparison tracer (rows) together with the 16% and 84% variations. The color red refers to the individual χ2 values: the darker the color, the worse the value. At the top of the matrix is plotted, for each reference tracer choice, the median with the 16% and 84% variations when summing the tracer walkers following Eq. (14).
Current usage metrics show cumulative count of Article Views (full-text article views including HTML views, PDF and ePub downloads, according to the available data) and Abstracts Views on Vision4Press platform.
Data correspond to usage on the plateform after 2015. The current usage metrics is available 48-96 hours after online publication and is updated daily on week days.
Initial download of the metrics may take a while.