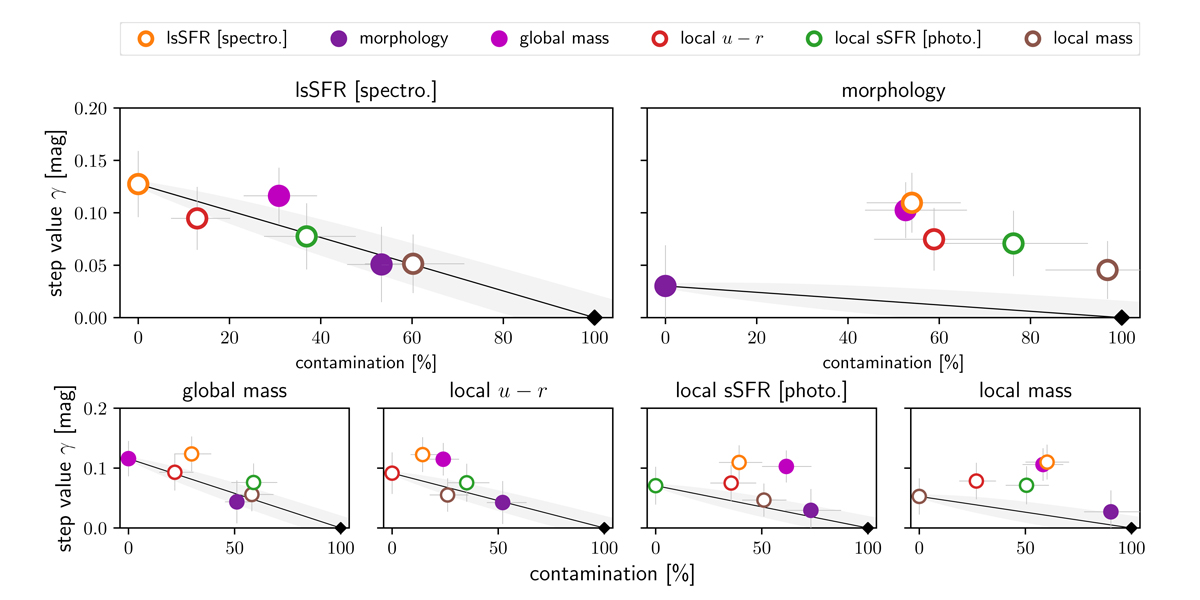
Fig. 5.
Download original image
Similar to Fig. 4, but changing the reference tracer choice by (from left to right, top to bottom) the spectroscopic lsSFR, the host galaxy morphology, the global host galaxy stellar mass, the local u − r color, the photometric lsSFR, and the local stellar mass. In this figure the α and β have been fixed to that of the reference tracer used in each subplot (see Sect. 6.1). The gray band around the black line is the expected scatter along the diagonal (see Sect. 6.2). The more the data deviate from the model expectation (black line), the less likely it is for the reference tracer to be closely connected to the actual underlying astrophysical origin.
Current usage metrics show cumulative count of Article Views (full-text article views including HTML views, PDF and ePub downloads, according to the available data) and Abstracts Views on Vision4Press platform.
Data correspond to usage on the plateform after 2015. The current usage metrics is available 48-96 hours after online publication and is updated daily on week days.
Initial download of the metrics may take a while.