Fig. 4.

Download original image
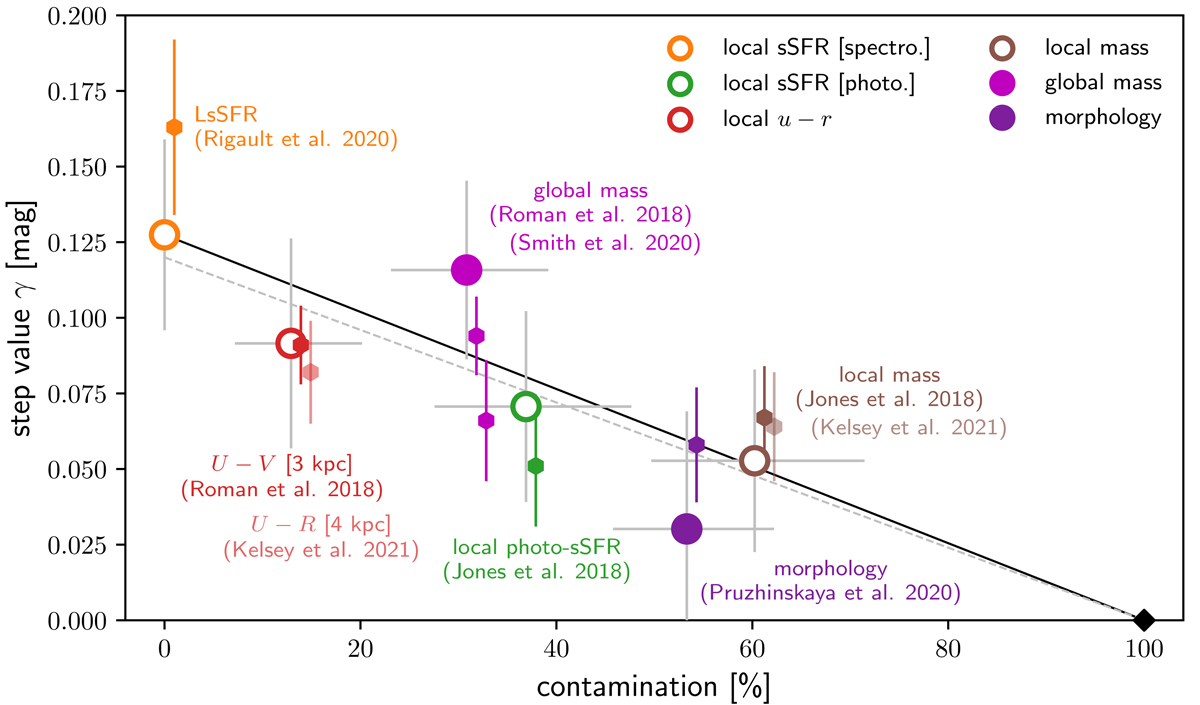
SNe Ia magnitude steps, γ, as a function of the tracer contamination (c = ca + cb), using the spectroscopic lsSFR as reference (cspec − lsSFR ≡ 0). The large circles are the steps derived using the SNfactory dataset (this work), while the small hexagons are the literature results (see Sect. 5). The large open (resp. full) circles are local (resp. global) measurements (see legend); the SNfactory-based and literature results have the same colors. The literature contaminations are those derived using the SNfactory sample and have been shifted by +1% for visibility. The Kelsey et al. (2021) related hexagonal markers are transparent as they measure the magnitude step after standardization, while all other data points (both with our SNfactory sample and the literature results) fit γ as a third standardization parameter (see Sect. 4.2). The full black diamond indicates the 0 mag step associated by definition with 100% contamination, corresponding to a random SN population classification. The straight black line shows our model of the measured step as a function of the contamination, linking the reference tracer point to the black diamond (see Sect. 2). The dashed gray line is a fit to the literature measurements, constrained to pass through the random classification value (black diamond).
Current usage metrics show cumulative count of Article Views (full-text article views including HTML views, PDF and ePub downloads, according to the available data) and Abstracts Views on Vision4Press platform.
Data correspond to usage on the plateform after 2015. The current usage metrics is available 48-96 hours after online publication and is updated daily on week days.
Initial download of the metrics may take a while.


