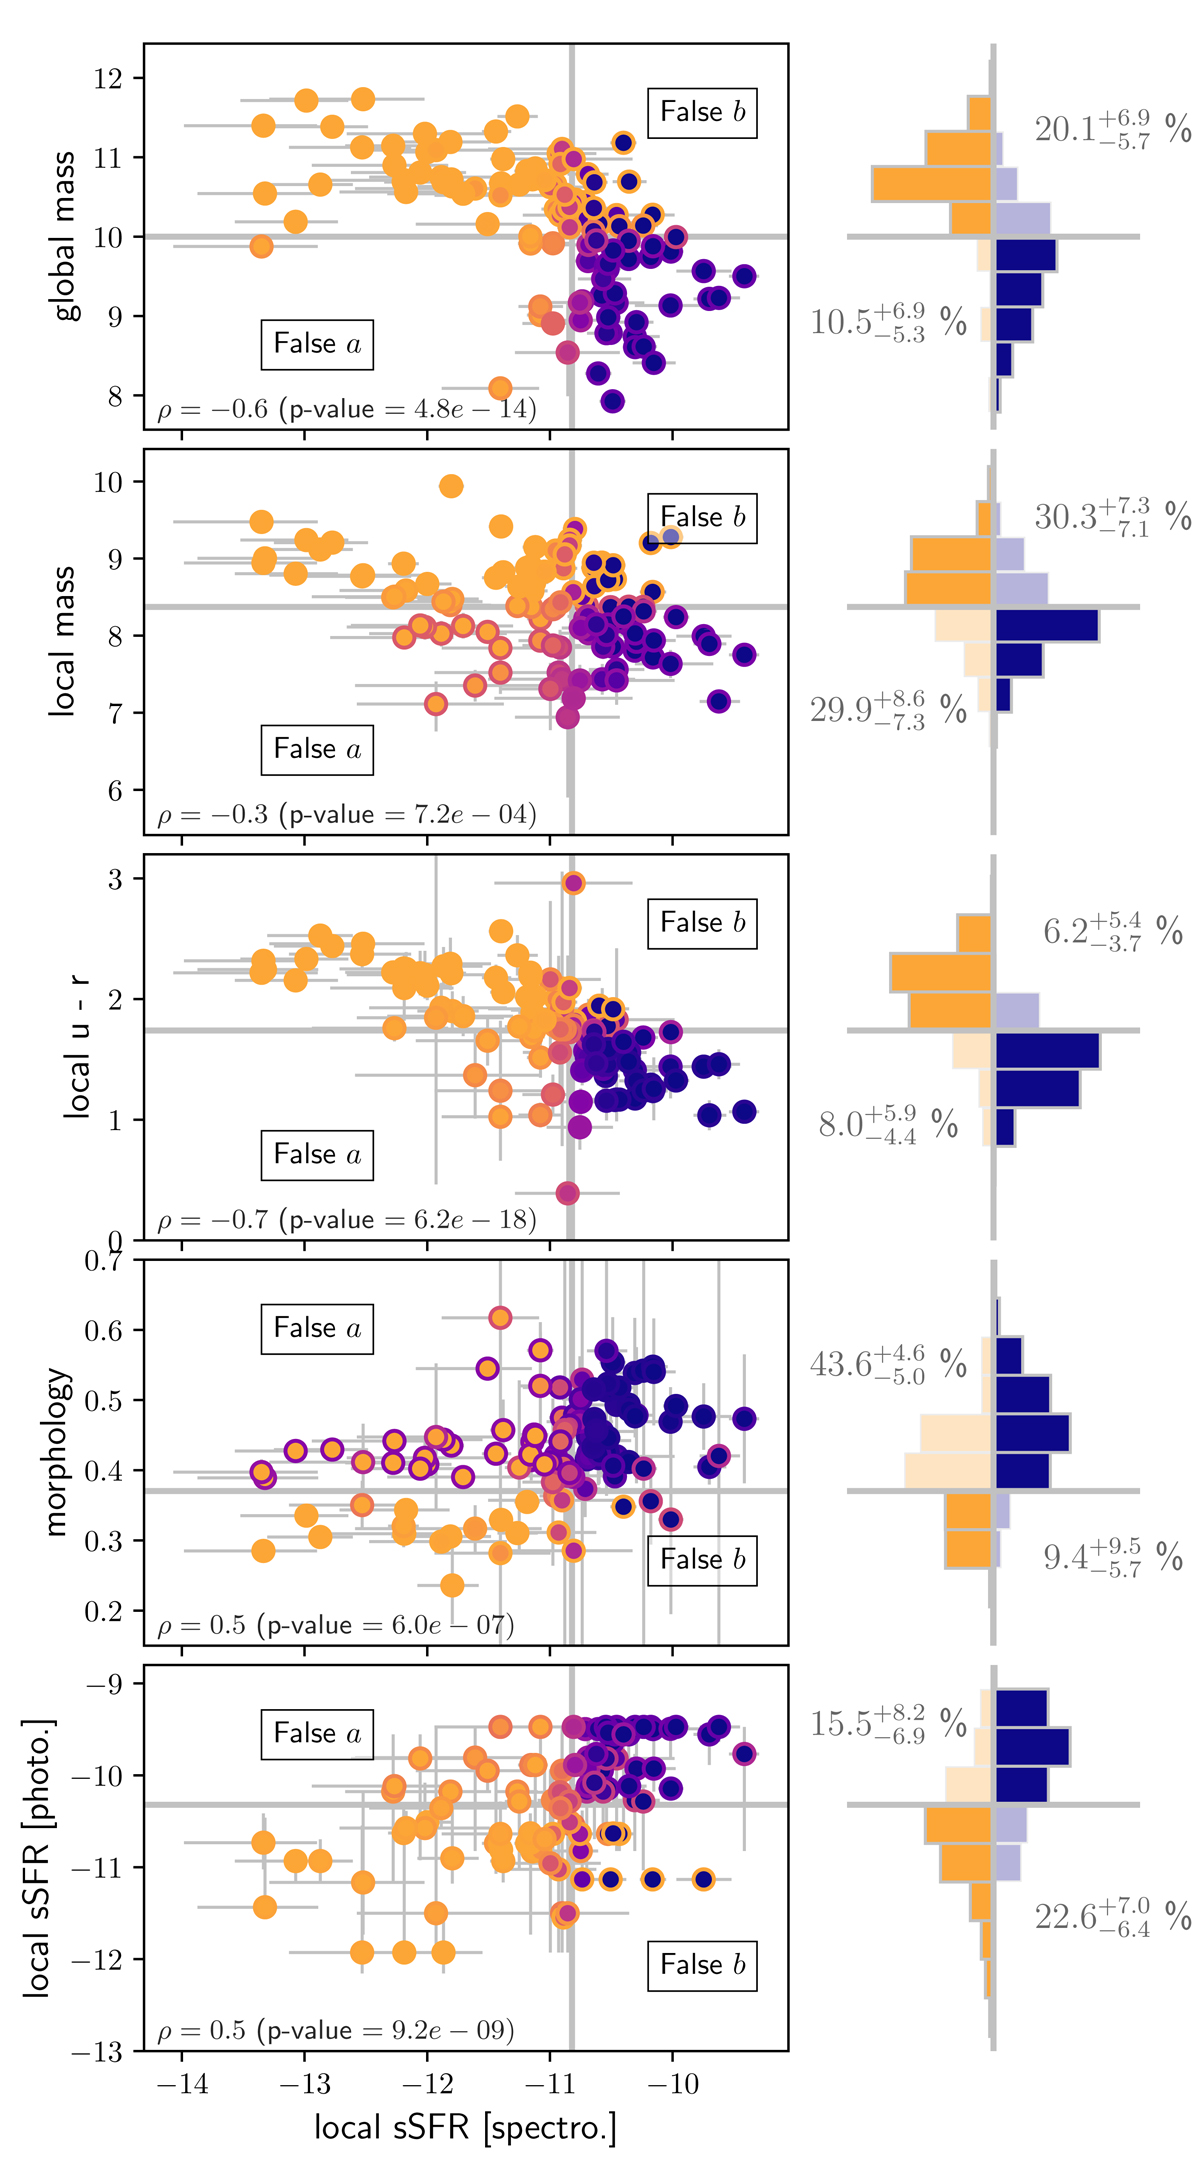
Fig. 3.
Download original image
Correlation between each environmental tracer and the spectroscopic lsSFR, as mentioned in Sect. 4. The vertical gray line is the spectroscopic lsSFR cutoff, set at log(lsSFR) = − 10.82 dex. The horizontal gray lines are the other tracer cutoffs, as defined in Sect. 4. Each figure indicates the false a and false b classification quadrants. The color of the circles, which vary from orange to blue, represents the probability for a SN Ia to be in population a (blue) or b (orange) from the spectroscopic lsSFR point of view, whereas the edge color represents the same probability, but from the comparison tracer point of view. In the right column, the histograms plot the distributions in each quadrant. Orange (resp. blue) bars correspond to the truly b (resp. a) spectroscopic lsSFR classification. The estimated ca and cb parameters are given in percentages within the corresponding quadrants where the histogram is transparent.
Current usage metrics show cumulative count of Article Views (full-text article views including HTML views, PDF and ePub downloads, according to the available data) and Abstracts Views on Vision4Press platform.
Data correspond to usage on the plateform after 2015. The current usage metrics is available 48-96 hours after online publication and is updated daily on week days.
Initial download of the metrics may take a while.