Fig. 2.
Download original image
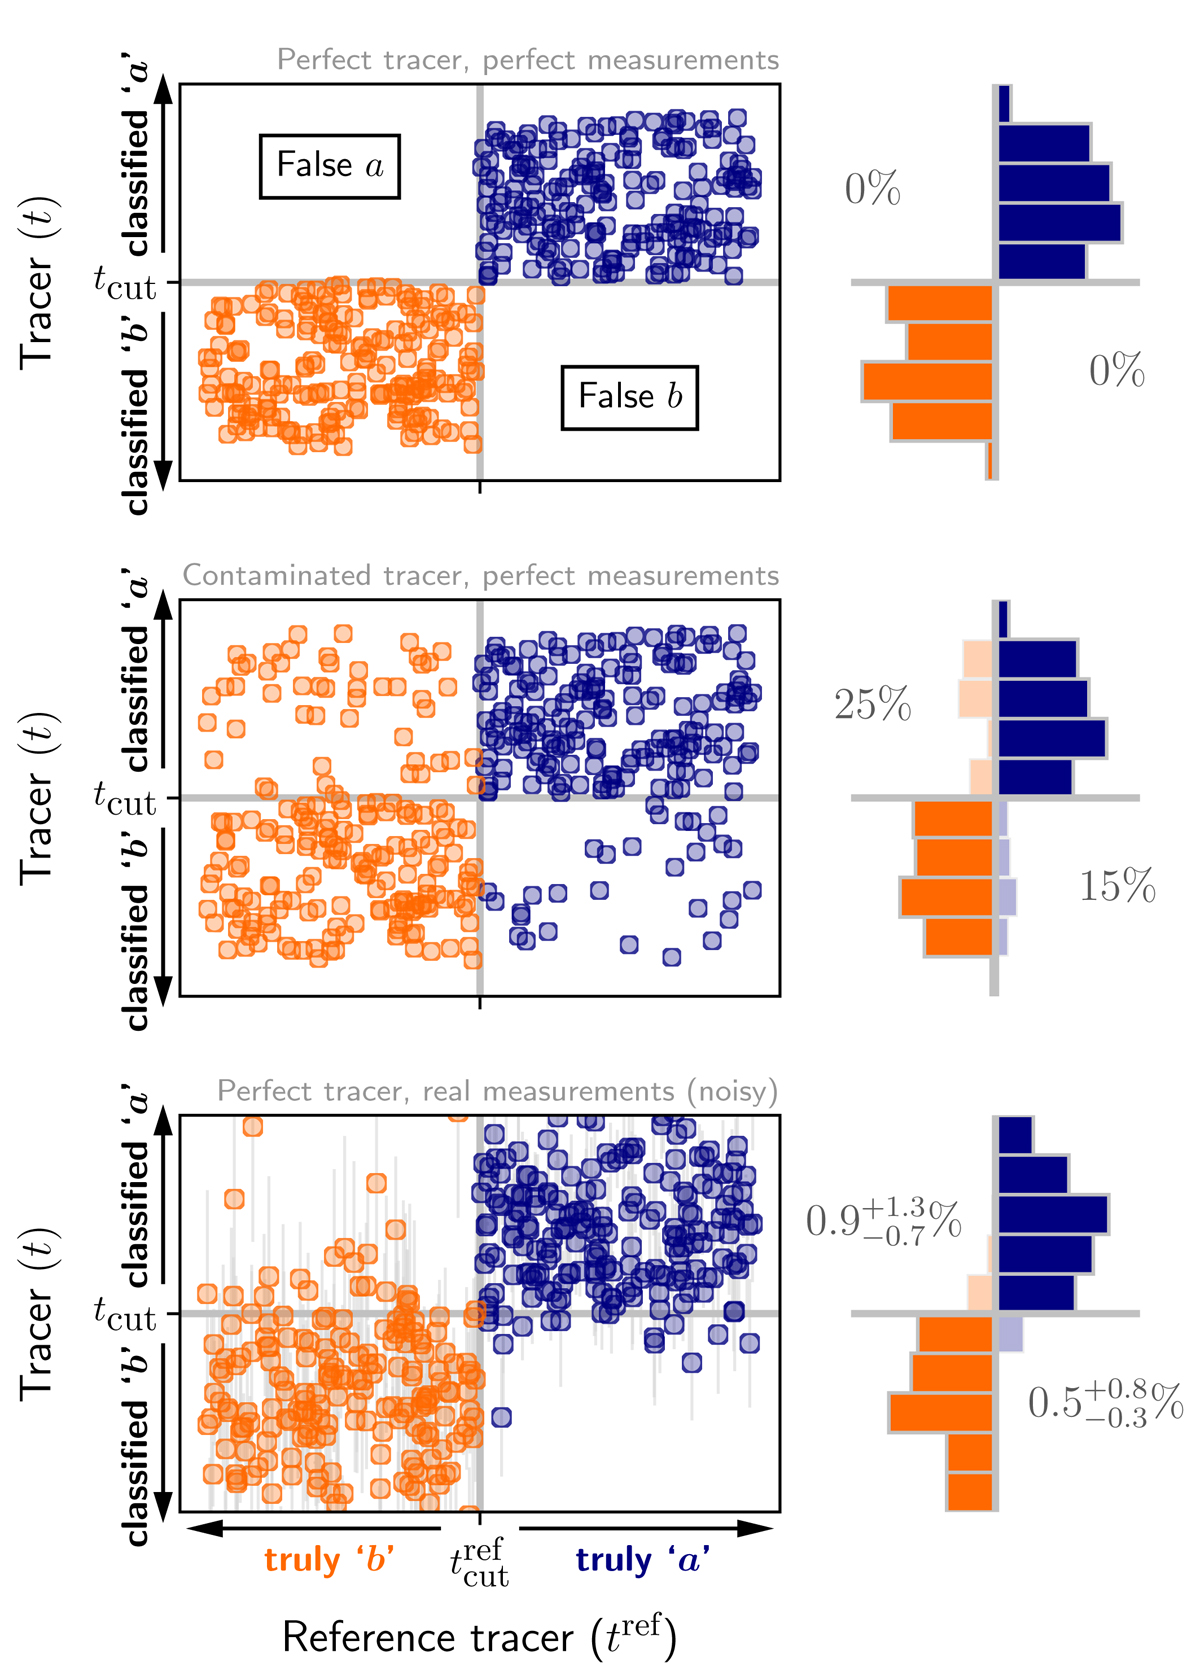
Correlation between uniform mock reference and comparison tracers. The color indicates the true classification following the color-coding in Fig. 1: blue for a, orange for b. The right panel of each row shows the marginalized distribution of each quadrant, following the color-coding of the circles. The light histograms correspond to the off-diagonal terms: false a in light orange, false b in light blue. Top panels: perfect and noise-free tracer, i.e., without any off-diagonal points; middle panels: imperfect (ca = 15% and cb = 25%) yet noise-free tracer, the sum of its off-diagonal terms corresponds to its contamination parameters; bottom panels: perfect but noisy tracer. In this case, plain off-diagonal fractions are 11% in false a and 7.5% in false b, while both should be 0% for a perfect tracer; the likelihood estimator (Eq. (11), see Sect. 2.4), properly accounting for the fraction of off-diagonal terms caused by measurement errors, provides contamination estimates ![]() and
and ![]() , compatible with zero.
, compatible with zero.
Current usage metrics show cumulative count of Article Views (full-text article views including HTML views, PDF and ePub downloads, according to the available data) and Abstracts Views on Vision4Press platform.
Data correspond to usage on the plateform after 2015. The current usage metrics is available 48-96 hours after online publication and is updated daily on week days.
Initial download of the metrics may take a while.