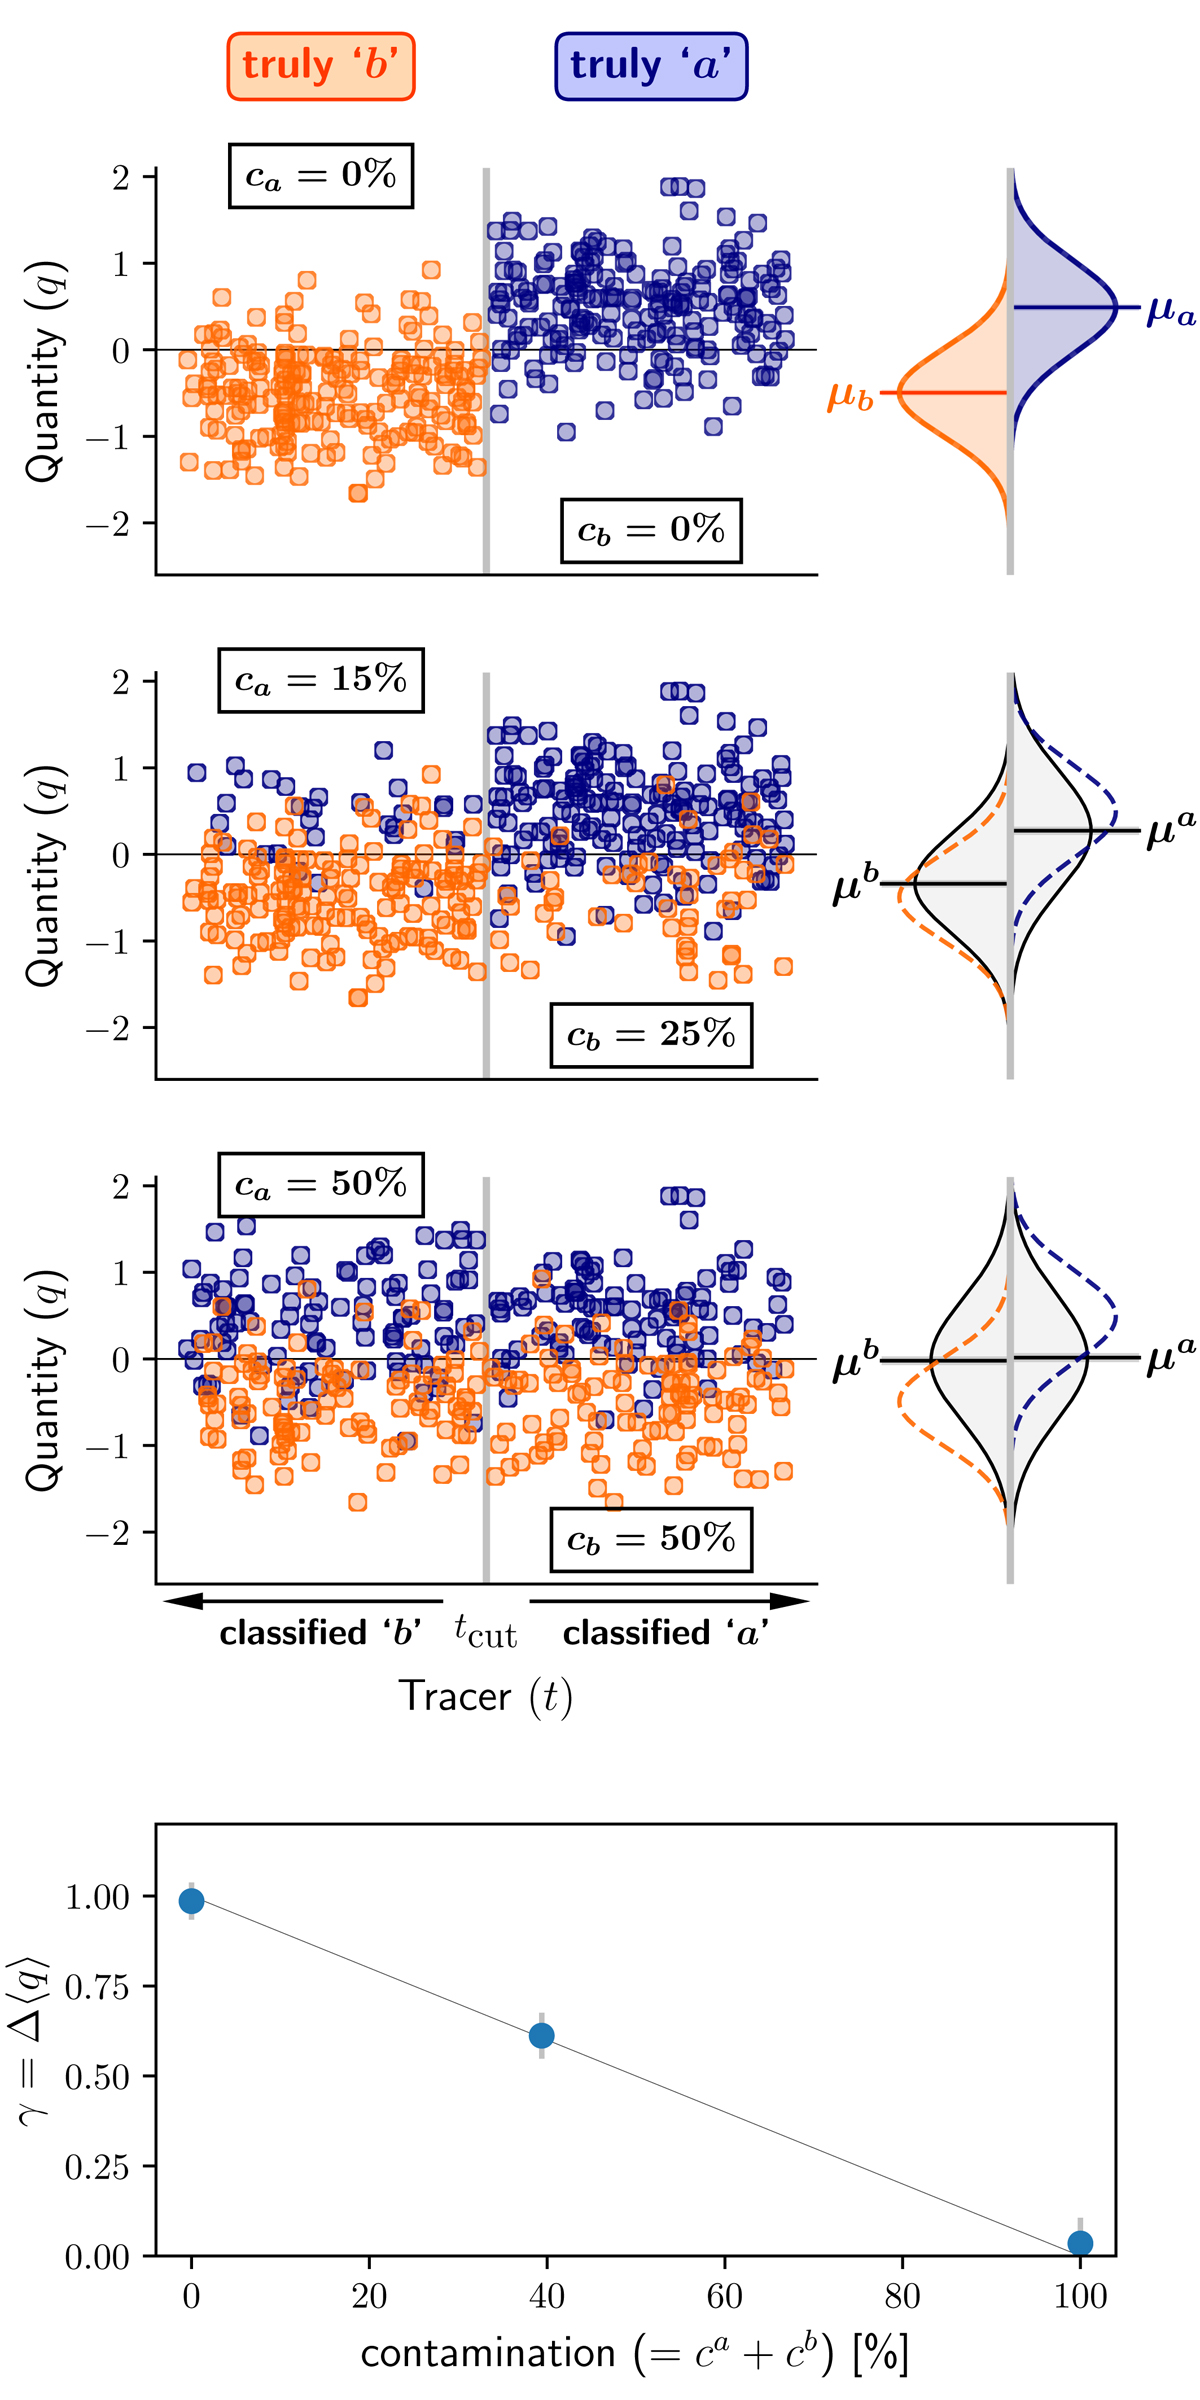
Fig. 1.
Download original image
Concept of tracer purity and its impact on the step measurement of an arbitrary quantity q. Top three panels: 400 mock data, 200 of category a (in blue), normally distributed over the quantity q by 𝒩(μa = 0.5, σa = 0.5), and 200 of category b (in orange) with a similar distribution 𝒩(μb = −0.5, σb = 0.5). The figure shows the mock q values as a function of the tracer values t for three different tracers. The data are classified as a or b given the tracer values if they are measured above or below tcut, respectively. The top, middle, and bottom panels show tracers with perfect, medium, and null ability to track the two categories. The right panels show the tracer estimation of the q distribution for each tracer (in gray), to be compared to the true q distribution for each category (colored dashed lines). Bottom panel: evolution of the observed step γ = μa − μb, the difference of mean q values for targets classified as a or b by the tracers, as a function of the tracer contamination c = ca + cb; the circles show each of the three simulations illustrated in the top panels, while the line shows the prediction from Eq. (3).
Current usage metrics show cumulative count of Article Views (full-text article views including HTML views, PDF and ePub downloads, according to the available data) and Abstracts Views on Vision4Press platform.
Data correspond to usage on the plateform after 2015. The current usage metrics is available 48-96 hours after online publication and is updated daily on week days.
Initial download of the metrics may take a while.