| Issue |
A&A
Volume 657, January 2022
|
|
|---|---|---|
| Article Number | A124 | |
| Number of page(s) | 8 | |
| Section | Stellar structure and evolution | |
| DOI | https://doi.org/10.1051/0004-6361/202140747 | |
| Published online | 21 January 2022 | |
Overall spectral properties of prompt emissions with diverse segments in Swift/BAT short gamma-ray bursts
School of Physics and Physical Engineering, Qufu Normal University, Qufu 273165, PR China
e-mail: This email address is being protected from spambots. You need JavaScript enabled to view it.
Received:
8
March
2021
Accepted:
4
October
2021
Abstract
Owing to a lack of multiple components of prompt γ-ray emissions in short gamma-ray bursts (sGRBs), how these distinct components are correlated remains unclear. In this paper we investigate the spectral and temporal properties of precursors, main peaks, and extended emissions in 26 sGRBs including GRB 170817A. It has been found that peak energies (Ep) in each pulse are uncorrelated with the pulse duration (tdur). Meanwhile, we find that there is no obvious correlation between peak energy and energy fluence. Interestingly, there is no obvious spectral evolution from earlier precursors to later extended emissions in view of the correlations of tdur with either the Ep or the low-energy spectrum index, α. A power-law correlation between the average flux (Fp) and the energy fluence (Sγ), log Fp = (0.62 ± 0.07) log Sγ + (0.27 ± 0.07), is found to exist in the individual segments instead of mean peaks. Furthermore, we also find that the main peaks are on average brighter than the precursors or the extend emissions by about one order of magnitude. On the basis of all the above analyses, we can conclude that three emissive components could share the same radiation mechanisms, but that they might be dominated by diverse physical processes.
Key words: gamma-ray burst: general / stars: late-type / methods: statistical
© ESO 2022
1. Introduction
The Swift satellite was successfully launched in 2004 November (Gehrels et al. 2004) and detected over 1300 gamma-ray bursts (GRBs) by 2019 November. According to the classification criterion of the T90 duration distribution (Kouveliotou et al. 1993), approximately 10% are short GRBs (sGRBs), with a typical duration of T90 < 2s (Zhang & Choi 2008; Zhang et al. 2018a). Prompt garmma-ray emissions of GRBs may consist of diverse components, namely precursors, main peaks, and extended emissions (EEs), or parts of them, within both long GRBs (lGRBs) and sGRBs (Metzger et al. 1974; Koshut et al. 1995; Norris & Bonnell 2006; Troja et al. 2010; Bernardini et al. 2013; Hu et al. 2014; Lan et al. 2018, 2020; Zhang et al. 2018b, 2020a; Zhong et al. 2019; Li et al. 2021) or both type I and II GRBs (Li et al. 2020b). The precursor reported first in GRB 720427 is a dim peak occurring before the brightest prompt emission of the main peaks (Metzger et al. 1974); another important component is the EE, which is the softer γ-ray emissions usually following the main peaks after a quiescent period (e.g., Lazzati et al. 2001; Connaughton 2002; Burrows et al. 2005).
Some authors argue that there are no obvious correlations between the precursors and the main peaks (Koshut et al. 1995; Lazzati 2005; Burlon et al. 2008, 2009; Charisi et al. 2015). Some others have extracted and compared the temporal and spectral characteristics of EEs with main peaks (Norris et al. 2010, 2011; Bostancı et al. 2013; Kaneko et al. 2015; Kagawa et al. 2015; Lien et al. 2016; Anand et al. 2018). For example, Zhong et al. (2019) extracted 18 sGRB candidates with precursors observed by Fermi/GBM and Swift/BAT. They found that the average flux of precursor components tends to increase with that of the main peaks. They compared the hard ratio and the cutoff energy Ec between these two emission episodes, suggesting that the main peaks are slightly harder than the precursors. Recently, Lan et al. (2020) identified 26 Fermi/GBM sGRBs with early EE similar to GRB 060614. Their results suggested that the sGRBs with EE probably have a similar physical origin. Particularly, they compared the properties of GRB 170817A, as the first gravitational-wave-associated sGRB with EE (Abbott et al. 2017; Goldstein et al. 2017), with other sGRBs with EE and found that there are no significant statistical differences between them.
Prompt GRB emissions are often produced by either the quasi-thermal mechanism from the photosphere of a fireball or the synchrotron radiation mechanism from electrons of the Poynting-flux-dominated jet (Katz 1994; Meszaros et al. 1994; Thompson 1994; Rees & Meszaros 1994; Daigne & Mochkovitch 1998; Zhang & Yan 2011; Deng & Zhang 2014; Deng et al. 2015; Beniamini & Giannios 2017; Lazarian et al. 2019; Meng et al. 2018, 2019; Li 2019a; Ryde et al. 2019). It is generally accepted that the low-energy photon index is an indicator of the emission mechanism, used to distinguish between synchrotron and photosphere emissions (Li 2019b). Around 50% of Swift GRBs are better explained by the blackbody (BB) spectrum for most X-ray flashes (XRFs) plus X-ray-rich GRBs (XRBs) or the synchrotron radiation mechanism for most classical GRBs (C-GRBs; Oganesyan et al. 2019; Zhang et al. 2020b). Lan et al. (2018) systematically studied the spectral and temporal properties of two emission episodes separated by quiescent gaps for 101 Fermi/GBM lGRBs. They found similar distributions of peak energy between two emission episodes and suggested that the two have the same physical origin. However, it was found that the thermal component appears in the first emission episode and a transition from the thermal to the non-thermal component may exist in multipulse Fermi GRBs in the prompt gamma-ray emission phase (Zhang et al. 2018b; Li 2019a,b).
Zhang et al. (2018c) studied the time-resolved spectra in each episode of GRB 160625B detected by Fermi, from precursor to main peaks and to extended emission. They announced a transition from a thermal to a non-thermal mechanism within the GRB. The indisputable fact is that these investigations were mainly performed for long bursts, and short bursts were not included due to the absence of sGRBs with multiple components. Recently, we defined two kinds of double-peaked BATSE sGRBs as M-loose and M-tight types according to the overlapping ratios between two adjacent main peaks (see Fig. 1 in Li et al. 2020a). Then we examined the temporal properties of the main peaks and the other two components of Swift/BAT sGRBs (Li et al. 2021). We adopted a united criterion to search for precursors and EEs: their signals prior and posterior to the main peaks must be at least S/N > 3 above background (see Sect. 2.2 in Li et al. 2021). Unfortunately, no such triplets have been reported in single sGRB to date. Considering the above controversial results, we instead generalize the spectral analysis and evolution of the three components by using sGRB samples with any two components. In this way, it is possible to simultaneously investigate the time-integrated spectral properties of the three components of sGRBs with single or double main peaks. In addition, we examine how the spectra evolve from precursor, main peak, to extended emission. Sample selection and spectra analysis are presented in Sect. 2. Section 3 presents our temporal and spectral results of these sGRBs. We end with the conclusions and discussions in Sect. 4.
2. Data analysis method
From 2004 December to 2019 July Swift/BAT detected 124 sGRBs, 26 of which have been selected for this study: 12 single-peaked sGRBs (SPs), 5 double-peaked sGRBs (DPs), 7 sGRBs with precursor (Pre+sGRBs), and 2 sGRBs with EE (sGRBs+EE). For the DPs, we still divide them into the M-tight (Mt-DPs) and the M-loose (Ml-DPs) types, as done in our recent works (Li et al. 2020a, 2021). The criteria that we used to identify a significant precursor or EE pulse can be found in our recent paper (Li et al. 2021). The standard BAT software (HEADAS 6.26.1) and the latest calibration database (CALDB: 2017-10-16) were used. We refer to the BAT analysis threads1 for the handling process.
The mask-weighted light curve data of the sGRBs with a 8 ms resolution are taken from the Swift website (Lien et al. 2016)2. We note that all light curves of the selected 26 Swift/BAT sGRBs can be well fitted by the empirical Kocevski-Ryde-Liang (KRL) function that has been used in the literature (e.g., Kocevski et al. 2003; Zhang & Qin 2005; Li et al. 2020a, 2021). Figure 1 shows five representative cases that can be fitted successfully according to the reduced chi-square standard together with a residual assessment (Li et al. 2020a, 2021). The KRL function with five free parameters is
![Mathematical equation: $$ \begin{aligned} f(t)=f_m\left(\frac{t+t_0}{t_m+t_0}\right)^r\left[\frac{d}{d+r}+\frac{r}{d+r}\left(\frac{t+t_0}{t_m+t_0}\right)^{(r+1)}\right]^{-(\frac{r+d}{r+1})}, \end{aligned} $$](/articles/aa/full_html/2022/01/aa40747-21/aa40747-21-eq1.gif) (1)
(1)
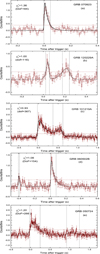 |
Fig. 1. Light curves (15–350 KeV) of five typical sGRBs. The horizontal dashed lines indicates the 3σ confidence level. The vertical dashed lines show the starting and the ending times of the emission target pulses: (a) single pulse; (b) M-loose; (c) M-tight; (d) main peak with precursor; (e) main peak with EE. |
where r and d respectively determine the rise and the decay shapes of an individual pulse, fm represents the peak flux, tm is the peak time, and t0 is the offset of the pulse from the trigger time. The fitting processes have been conducted in the energy channel 15–350 keV. We define the duration of an emission segment as tdur = te − ts, where ts and te are the starting and the ending times of a given pulse at the level of S/N = 3. Based on the above fitting with Eq. (1), we can easily obtain all temporal features of different kinds of sGRBs. Finally, our sample includes 42 GRB pulses, of which 33, 7, and 2 pulses are main peaks, precursors, and EEs, respectively. The fitting parameters are listed in Table A.1.
Subsequently, we used the software XSPEC to perform the model fitting of the spectrum of each episode, as shown in Fig. 1. A power-law (PL) or cutoff power-law (CPL) spectral form was applied to fit the GRB spectra because the Swift/BAT has a narrow energy band (see also Zhang et al. 2020b). The PL model is written as
 (2)
(2)
where N0, PL is the photon flux (photons cm−2 keV−1 s−1), E is the photon energy, and αpl is the low photon spectral index. The CPL model can be written as
 (3)
(3)
where N0, CPL is the photon flux (photons cm−2 keV−1 s−1), E is the photon energy, αcpl is the low photon spectral index, and Ep is the peak energy in keV. In addition, a Planck blackbody (BB) function used to identify the thermal component can be expressed as
![Mathematical equation: $$ \begin{aligned} N_{E,BB}(E)=N_{0,BB}{\frac{8.0525E^2dE}{(kT)^4[\exp (E/kT)-1]}}, \end{aligned} $$](/articles/aa/full_html/2022/01/aa40747-21/aa40747-21-eq4.gif) (4)
(4)
where kT is the thermal energy of electrons and E is the photon energy, both energies are in units of keV. We note that the model is built in Xspec.
The reduced  is given to estimate the goodness of spectrum fitting. We choose CPL if
  and PL if
  as the best-fit model (Sakamoto et al. 2009; Lien et al. 2016; Katsukura et al. 2020). This criterion is used in the BAT team to report the spectral parameters based on a CPL fit. In summary, Table A.2 lists the results of the temporal and spectral properties of 26 typical Swift/BAT sGRBs. We note that we use the time of the valleys as the boundary of overlapping pulses in Mt-DPs. Because of relatively weak EE signal, the duration of sGRB 050724 is defined in terms of the time domain when the fitted intensity is equal to e−1 of its maximum value. We also note that our sample includes the first gravitational-wave-associated GRB 170817A detected by Fermi/GBM (Goldstein et al. 2017; Savchenko et al. 2017). Zhang et al. (2018c) reported the detailed temporal and spectral properties for the main peaks and the EE components. Using their results, we compare the properties of GRB 170817A with those of the other typical sGRBs in our samples, thus it is beneficial for identifying the candidates similar to GRB 170817A.
3. Results
In this section we present the main results of temporal and spectral parameters such as pulse durations (tdur), peak energy (Ep), average flux (Fp), and energy fluence (Sγ)3 together with their correlations and evolutions.
3.1. Spectral characteristics of diverse prompt emission segments
Most Swift/BAT GRB spectra can be fitted by a simple PL, due to the narrow energy band (Zhang et al. 2007a,b; Sakamoto et al. 2011). Previous studies illustrated that the relation αpl − Ep can be employed as an indicator to estimate the Ep of a burst without good spectral breaks (Crider et al. 1997; Kaneko et al. 2006; Zhang et al. 2007b; Sakamoto et al. 2009; Virgili et al. 2012). This relation was first derived by Zhang et al. (2007b) and then confirmed by Virgili et al. (2012) as
 (5)
(5)
with a varied low-energy spectral index of 1.2 ≤ αpl ≤ 2.3. Similar to the conclusion of Sakamoto et al. (2009), the bursts with αpl < 1.2 should have a higher Ep far beyond the Swift/BAT band, while the bursts with αpl > 2.3 are likely X-ray flashes with Ep near or below the low-energy end of Swift/BAT (Zhang et al. 2007a,b).
Even though Eq. (5) is heavily dominated by lGRBs, the sGRBs are generally consistent with the relationship (see Fig. 2 in Zhang et al. 2007b). Additionally, using a completely new GRB sample, including 31 short and 252 long GRBs with well-measured peak energy and redshift, Zhang et al. (2018c) found that short and long GRBs hold the coincident Ep, i − Eiso correlations, indicating that both kinds of GRBs may share the same radiation mechanism, which is consistent with the conclusion of Minaev & Pozanenko (2020). Consequently, we assume that Eq. (5) is also available for sGRBs, together with their isolated emission components. We note that about 71% (30/42) of the segmental spectra can be well fitted by the PL. There are 16 segments with 1.2 ≤ αpl ≤ 2.3, whose Ep can be ideally fitted by Eq. (5).
3.1.1. GRB spectra in pulse durations
We estimate the Ep within each tdur of 30 isolated segments by way of either Eq. (5) for the PL spectra or the CPL fitting directly. Figure 2a shows that the pulse durations are lognormally distributed with a mean value of 0.12 ± 0.02 s. It can be seen in Fig. 2b that Ep and tdur are uncorrelated with each other, due to a much lower correlation coefficient of 0.14. This is largely different from the anti-correlation of Ep with T90 between sGRBs and lGRBs (e.g., Zhang & Choi 2008). Moreover, we also analyzed the relation between low-energy spectral index α and pulse width in Fig. 2c, where no correlation is found among them. No obviously spectral evolution across different prompt γ-ray components is manifested in Figs. 2b and c for the sGRBs. In general, the spectrum of late-time EEs is softer than that of the main peaks. However, almost all the EE segments identified in our sample occur within two seconds of the trigger time. It can be understood that the prompt sGRB spectra do not evolve in a very short period.
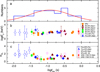 |
Fig. 2. Observational properties of pulse durations. Panel a: distribution of tdur for 30 segments with Ep measurement; Panel b: Ep plotted against tdur for 30 segments with Ep measurement; Panel c: αPL plotted against tdur for 30 segments. The main peaks are indicated with filled shapes, and the precursors or the EEs with empty shapes. |
3.1.2. Flux versus fluence
Figure 3 shows a tight correlation between Fp and Sγ. The correlation for our selected sGRB sample is
 (6)
(6)
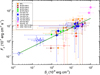 |
Fig. 3. Fp plotted against Sγ for 44 pulses including GRB 170817A in our sample. The olive line denotes the best logarithmic fit. All symbols are same as in Fig. 2. |
with a Pearson correlation coefficient ρ = 0.83 and a chance probability P = 5.6 × 10⁻¹². It should be noted that this correlation is valid only when all event pulses (including GRB 170817A) in our sample are considered. Noticeably, the values of Fp and Sγ of the precursors are lower than those of other components of sGRBs. It is worth nothing that GRB 170817A, an off-axis sGRB, is marginally coincident with Eq. (6) and will affect this correlation slightly when it is ignored.
3.1.3. Peak energy versus fluence
Recently, we studied the observed Ep − Sγ relations of 283 Swift GRBs comprising 252 lGRBs and 31 sGRBs with known redshift and measured Ep; we found that sGRBs and lGRBs are differently distributed in the plane of Ep versus Sγ (Zhang et al. 2018a). More recently, Zhang et al. (2020b) proposed a useful correlation of  that can be applied as an Ep indicator for those bursts with unknown Ep (Zhang et al. 2020b). Motivated by these results, we now focus on the analysis of the same correlation for the diverse emission segments in sGRBs whose light curves can be well fitted, as shown in Fig. 1. Figure 4 shows, surprisingly, that there is no obvious correlation between Ep and Sγ with a Pearson coefficient of 0.16 and a chance probability of 0.39, which primarily results from the independence of peak energy on pulse duration, as exhibited in Fig. 2. The solid and dashed lines show the empirical relation of Ep and Sγ of the sGRBs and lGRBs with well-measured spectra proposed by Zhang et al. (2020b). We note that GRB 170817A resides among the sGRB group, which is very similar to the finding for 31 sGRBs with known redshift by Zhang et al. (2018a) and the short or type E-II GRBs with EE in Zhang et al. (2020a).
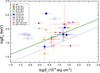 |
Fig. 4. Ep plotted against Sγ for 30 segments including GRB 170817A. The solid olive and dashed blue lines are the best logarithmic fits to the correlation between Sγ and Ep for the sGRBs and lGRBs in Zhang et al. (2020b). All symbols are the same as in Fig. 2. |
3.2. Spectral evolution
3.2.1. Radiative intensity of diverse segments
In order to test whether the spectra of sGRBs evolve from the early components to the later one in the phase of prompt γ-ray emissions, we compare the peak flux Fp of the early pulse (Fp, e) with the later pulse (Fp, l), and with other key spectral parameters (Ep and Sγ).
We compare the peak flux densities of main peaks with both precursors and EEs in Fig. 5, where it can seen that the main peaks are on average brighter than the other two components by about one order of magnitude (see also Zhang et al. 2020a). In addition, two types of DPs lying near to the dotted line, shows that the brightness of two main peaks are comparable with each other, which is consistent with the conclusion drawn by Lan et al. (2018). Based on an analysis of Pre+Mt-DP 100625A and Mt-DP+EE 130603B, we find that the peak fluxes of two main peaks are similar to the isolated Mt-DPs. Furthermore, we find similar results for the observed fluence Sγ in Fig. 6.
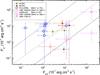 |
Fig. 5. Comparison between Fp of the early and the later pulses in the one-component sGRBs (filled symbols, for two types of DP) and the two-component sGRBs (empty symbols). The three peak flux ratios of Fp, l to Fp, e are shown as the dashed, dotted, and dash-dotted lines for 10, 1, and 1/10, respectively. |
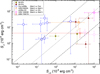 |
Fig. 6. Comparison between Sγ of the early and the later pulses in the one-component sGRBs (filled symbols, for two types of DP) and the two-component sGRBs (empty symbols). The three peak flux ratios of Sγ, l to Sγ, e are shown as the dashed, dotted, and dash-dotted lines for 10, 1, and 1/10, respectively. |
3.2.2. Features of spectral evolution
Zhang et al. (2007a) reported that the burst with αpl > 2.3 is likely a softer gamma event called XRF with peak energy near or below the low-energy end of BAT. In this case Eq. (5) cannot be used to estimate the Ep. For two precursors with αpl > 2.3 of GRBs 100702A and 100625A, we try to invoke the Planck blackbody model (Eq. (4)) to fit the spectra and obtain the thermal energy of electrons KT = 6.02 ± 1.57 KeV and KT = 9.04 ± 1.98 KeV, indicating that the thermal contributions to GRB spectra are negligible. On the other hand, it is found that there are 12 main peaks whose best models are PL with αpl < 1.2, including SPs, Pre+SPs, Pre+DPs, and sGRB+EE. In this situation Eq. (5) cannot be used to also estimate the Ep effectively, since the Ep will be outside the BAT band. Moreover, we find that the EEs of GRBs 050724 and 130603B are slightly softer than their main peaks, which is consistent with some previous conclusions (e.g., Norris & Bonnell 2006; Norris et al. 2010; Kagawa et al. 2015). However, we emphasize that the spectra of sGRBs in our sample do not evolve during the prompt γ-ray emission epoch, which challenges the known theoretical models for the precursors and the EEs (e.g., Murakami et al. 1991; Lyutikov & Usov 2000; Metzger et al. 2011). On the other hand, the non-evolutionary phenomena can be supported by the zero lags of light curves between different energy channels for sGRBs (e.g., Norris & Bonnell 2006; Zhang et al. 2006). Given the plots shown in Fig. 2, we can conclude that the parameters Ep and α are two representative qualities describing the spectral evolution consistently (see also Ghirlanda et al. 2004).
4. Conclusions and discussions
In this paper, the temporal and spectral features of diverse prompt gamma-ray components have been systematically studied. We summarize the major results as follows:
(1) We find that the peak energies of diverse γ-ray radiation segments in sGRBs with single or double main peaks are uncorrelated with the corresponding tdur.
(2) We find a tight correlation between Fp and Sγ for different segments to be log Fp = (0.62 ± 0.07) log Sγ + (0.27 ± 0.07).
(3) In the plane of Ep versus Sγ, these diverse γ-ray radiation segments in sGRBs distribute near to the line of  found by Zhang et al. (2020b) for those sGRBs with a well-measured spectrum. However, there is no obvious overall correlation found between Ep and Sγ for these segments.
(4) The main peaks are on average brighter than the precursors or EEs by about one order of magnitude. Our result for the EEs is consistent with Zhang et al. (2020a).
(5) In terms of the analyses of peak energies and low spectral index of diverse γ-ray radiation segments, we find that the sGRB spectra of precursors, main peaks, and EEs exhibit no obvious evolutionary sequence.
Unfortunately, since the absences of the EEs or precursors might be related to sensitivity or energy coverage of the current GRB detectors, no sGRBs with three distinct components have been observed. For example, though the Fermi/GBM with a broader energy band had identified over 2000 GRBs (von Kienlin et al. 2020), only 4 of the 244 precursors are identified in sGRBs (Coppin et al. 2020). Fortunately, more and more GRB monitors have been launched or plan to be launched to meet the increasing requirements of the X-ray/gamma-ray counterpart observation. More than 200 GRBs were detected by the Chinese first X-ray astronomical satellite Hard X-ray Modulation Telescope (HXMT), thanks to its wider energy coverage from 1 keV to 3 MeV, large filed of view, and good sensitivity (Zhang et al. 2020c; Liu et al. 2020). The Gravitational wave high-energy Electromagnetic Counterpart All-sky Monitor (GECAM), which has an all-sky field of view, a high sensitivity, and a wide energy interval (6 keV–5 MeV), was launched in 2020 (Liao et al. 2020; Song et al. 2020; Chen et al. 2020). Meanwhile, the Space-based multi-band astronomical Variable Objects Monitor (SVOM), whose energy range is from 15 keV to 5 MeV, aims to detect very distant and faint or soft nearby GRBs. SVOM with rapid slew capability will provide GRB positions and spectral parameters on very short timescale in the coming decade through a collection of instruments in various gamma-ray and X-ray energy bands, and at visible wavelengths through a narrow field-of-view telescope (Wei et al. 2016). Hopefully, our results can shed new light on the studies of the physical processes of sGRBs. Meanwhile, further search for three-component sGRBs simultaneously from the Fermi, HXMT, GECAM, and SVOM catalogs can draw more robust conclusions in the future.
The fluence is calculated in the energy range of 15–350 keV.
Acknowledgments
We thank the anonymous referee for very helpful suggestion and constructive comments. This work was supported by the National Natural Science Foundation of China (No. U2031118), the Youth Innovations and Talents Project of Shandong Provincial Colleges and Universities (Grant No. 201909118) and the Natural Science Foundations (ZR2018MA030, XKJJC201901).
References
- Abbott, B. P., Abbott, R., Abbott, T. D., et al. 2017, ApJ, 848, L13 [CrossRef] [Google Scholar]
- Anand, N., Shahid, M., & Resmi, L. 2018, MNRAS, 481, 4332 [NASA ADS] [CrossRef] [Google Scholar]
- Beniamini, P., & Giannios, D. 2017, MNRAS, 468, 3202 [NASA ADS] [CrossRef] [Google Scholar]
- Bernardini, M. G., Campana, S., Ghisellini, G., et al. 2013, ApJ, 775, 67 [NASA ADS] [CrossRef] [Google Scholar]
- Burlon, D., Ghirlanda, G., Ghisellini, G., et al. 2008, ApJ, 685, L19 [NASA ADS] [CrossRef] [Google Scholar]
- Burlon, D., Ghirlanda, G., Ghisellini, G., et al. 2009, A&A, 505, 569 [NASA ADS] [CrossRef] [EDP Sciences] [Google Scholar]
- Burrows, D. N., Romano, P., Falcone, A., et al. 2005, Science, 309, 1833 [NASA ADS] [CrossRef] [Google Scholar]
- Bostancı, Z. F., Kaneko, Y., & Göğüş, E. 2013, MNRAS, 428, 1623 [CrossRef] [Google Scholar]
- Charisi, M., Marka, S., & Bartos, I. 2015, MNRAS, 448, 2624 [NASA ADS] [CrossRef] [Google Scholar]
- Chen, W., Song, L. M., Zheng, S. J., et al. 2020, Sci. China-Phys. Mech. Astron., 50, 129512 [NASA ADS] [CrossRef] [Google Scholar]
- Colgate, S. A. 1974, ApJ, 187, 333 [NASA ADS] [CrossRef] [Google Scholar]
- Connaughton, V. 2002, ApJ, 567, 1028 [CrossRef] [Google Scholar]
- Coppin, P., de Vries, K. D., & van Eijndhoven, N. 2020, Phys. Rev. D, 102, 103014 [Google Scholar]
- Crider, A., Liang, E. P., Smith, I. A., et al. 1997, ApJ, 479, L39 [NASA ADS] [CrossRef] [Google Scholar]
- Daigne, F., & Mochkovitch, R. 1998, MNRAS, 296, 275 [NASA ADS] [CrossRef] [Google Scholar]
- Deng, W., & Zhang, B. 2014, ApJ, 785, 112 [NASA ADS] [CrossRef] [Google Scholar]
- Deng, W., Li, H., Zhang, B., et al. 2015, ApJ, 805, 163 [NASA ADS] [CrossRef] [Google Scholar]
- Dereli-Bégué, H., Pe’er, A., & Ryde, F. 2020, ApJ, 897, 145 [Google Scholar]
- Gehrels, N., Chincarini, G., Giommi, P., et al. 2004, ApJ, 611, 1005 [Google Scholar]
- Ghirlanda, G., Ghisellini, G., & Celotti, A. 2004, A&A, 422, L55 [NASA ADS] [CrossRef] [EDP Sciences] [Google Scholar]
- Goldstein, A., Veres, P., Burns, E., et al. 2017, ApJ, 848, L14 [CrossRef] [Google Scholar]
- Hu, Y.-D., Liang, E.-W., Xi, S.-Q., et al. 2014, ApJ, 789, 145 [Google Scholar]
- Kagawa, Y., Yonetoku, D., Sawano, T., et al. 2015, ApJ, 811, 4 [NASA ADS] [CrossRef] [Google Scholar]
- Kaneko, Y., Preece, R. D., Briggs, M. S., et al. 2006, ApJS, 166, 298 [CrossRef] [Google Scholar]
- Kaneko, Y., Bostancı, Z. F., Göğüş, E., et al. 2015, MNRAS, 452, 824 [NASA ADS] [CrossRef] [Google Scholar]
- Katsukura, D., Sakamoto, T., Tashiro, M. S., et al. 2020, ApJ, 889, 110 [NASA ADS] [Google Scholar]
- Katz, J. I. 1994, ApJ, 422, 248 [NASA ADS] [CrossRef] [Google Scholar]
- Kocevski, D., Ryde, F., & Liang, E. 2003, ApJ, 596, 389 [NASA ADS] [CrossRef] [Google Scholar]
- Koshut, T. M., Konveliotou, C., Paciesas, S. W., et al. 1995, ApJ, 452, 145 [NASA ADS] [CrossRef] [Google Scholar]
- Kouveliotou, C., Meegan, C. A., Fishman, G. J., et al. 1993, ApJ, 413, L101 [NASA ADS] [CrossRef] [Google Scholar]
- Lan, L., Lü, H.-J., Zhong, S.-Q., et al. 2018, ApJ, 862, 155 [Google Scholar]
- Lan, L., Lu, R.-J., Lü, H.-J., et al. 2020, MNRAS, 492, 3622 [NASA ADS] [CrossRef] [Google Scholar]
- Lazarian, A., Zhang, B., & Xu, S. 2019, ApJ, 882, 184 [NASA ADS] [CrossRef] [Google Scholar]
- Lazzati, D., Ramirez-Ruiz, E., & Ghisellini, G. 2001, A&A, 379, L39 [NASA ADS] [CrossRef] [EDP Sciences] [Google Scholar]
- Lazzati, D. 2005, MNRAS, 357, 722 [NASA ADS] [CrossRef] [Google Scholar]
- Li, L. 2019a, ApJS, 245, 7 [NASA ADS] [CrossRef] [Google Scholar]
- Li, L. 2019b, ApJS, 242, 16 [NASA ADS] [CrossRef] [Google Scholar]
- Liao, J. Y., Luo, Q., Zhu, Y., et al. 2020, Sci. China-Phys. Mech. Astron., 50, 129510 [NASA ADS] [CrossRef] [Google Scholar]
- Lien, A., Sakamoto, T., Barthelmy, S. D., et al. 2016, ApJ, 829, 7 [Google Scholar]
- Liu, C. Z., Zhang, Y. F., Li, X. F., et al. 2020, Sci. China-Phys. Mech. Astron., 63, 129510 [Google Scholar]
- Li, X. J., Zhang, Z. B., Zhang, C. T., et al. 2020a, ApJ, 892, 113 [CrossRef] [Google Scholar]
- Li, Y., Zhang, B., & Yuan, Q. 2020b, ApJ, 897, 154 [NASA ADS] [CrossRef] [Google Scholar]
- Li, X. J., Zhang, Z. B., Zhang, X. L., et al. 2021, ApJS, 252, 16 [CrossRef] [Google Scholar]
- Lyutikov, M., & Usov, V. V. 2000, ApJ, 543, L129 [NASA ADS] [CrossRef] [Google Scholar]
- Metzger, A. E., Parker, R. H., Gilman, D., et al. 1974, ApJ, 194, L19 [NASA ADS] [CrossRef] [Google Scholar]
- Metzger, B. D., Giannios, D., Thompson, T. A., et al. 2011, MNRAS, 413, 2031 [NASA ADS] [CrossRef] [Google Scholar]
- Meng, Y.-Z., Geng, J.-J., Zhang, B.-B., et al. 2018, ApJ, 860, 72 [NASA ADS] [CrossRef] [Google Scholar]
- Meng, Y.-Z., Liu, L.-D., Wei, J.-J., et al. 2019, ApJ, 882, 26 [NASA ADS] [CrossRef] [Google Scholar]
- Meszaros, P., Rees, M. J., & Papathanassiou, H. 1994, ApJ, 432, 181 [CrossRef] [Google Scholar]
- Minaev, P. Y., & Pozanenko, A. S. 2020, MNRAS, 492, 1919 [NASA ADS] [CrossRef] [Google Scholar]
- Murakami, T., Inoue, H., Nishimura, J., et al. 1991, Nature, 350, 592 [NASA ADS] [CrossRef] [Google Scholar]
- Norris, J. P., & Bonnell, J. T. 2006, ApJ, 643, 266 [NASA ADS] [CrossRef] [Google Scholar]
- Norris, J. P., Gehrels, N., & Scargle, J. D. 2010, ApJ, 717, 411 [NASA ADS] [CrossRef] [Google Scholar]
- Norris, J. P., Gehrels, N., & Scargle, J. D. 2011, ApJ, 735, 23 [NASA ADS] [CrossRef] [Google Scholar]
- Oganesyan, G., Nava, L., Ghirlanda, G., et al. 2019, A&A, 628, A59 [NASA ADS] [CrossRef] [EDP Sciences] [Google Scholar]
- Preece, R. D., Briggs, M. S., Mallozzi, R. S., et al. 1998, ApJ, 506, L23 [Google Scholar]
- Rees, M. J., & Meszaros, P. 1994, ApJ, 430, L93 [Google Scholar]
- Ryde, F., Yu, H.-F., Dereli-Bégué, H., et al. 2019, MNRAS, 484, 1912 [CrossRef] [Google Scholar]
- Sakamoto, T., Sato, G., Barbier, L., et al. 2009, ApJ, 693, 922 [NASA ADS] [CrossRef] [Google Scholar]
- Sakamoto, T., Barthelmy, S. D., Baumgartner, W. H., et al. 2011, ApJS, 195, 2 [Google Scholar]
- Savchenko, V., Ferrigno, C., Kuulkers, E., et al. 2017, ApJ, 848, L15 [CrossRef] [Google Scholar]
- Song, X. Y., Xiong, S. L., Luo, Q., et al. 2020, Sci. China-Phys. Mech. Astron., 50, 129511 [Google Scholar]
- Thompson, C. 1994, MNRAS, 270, 480 [NASA ADS] [CrossRef] [Google Scholar]
- Troja, E., Rosswog, S., & Gehrels, N. 2010, ApJ, 723, 1711 [NASA ADS] [CrossRef] [Google Scholar]
- Virgili, F. J., Qin, Y., Zhang, B., et al. 2012, MNRAS, 424, 2821 [CrossRef] [Google Scholar]
- von Kienlin, A., Meegan, C. A., Paciesas, W. S., et al. 2020, ApJ, 893, 46 [Google Scholar]
- Wei, J., Cordier, B., Antier, S., et al. 2016, ArXiv eprints [arXiv:1610.06892] [Google Scholar]
- Zhang, B., & Yan, H. R. 2011, ApJ, 726, 90 [NASA ADS] [CrossRef] [Google Scholar]
- Zhang, Z. B., & Choi, C. S. 2008, A&A, 484, 293 [NASA ADS] [CrossRef] [EDP Sciences] [Google Scholar]
- Zhang, Z. B., & Qin, Y. P. 2005, MNRAS, 363, 1290 [NASA ADS] [CrossRef] [Google Scholar]
- Zhang, Z. B., Xie, G. Z., Deng, J. G., et al. 2006, MNRAS, 373, 729 [NASA ADS] [CrossRef] [Google Scholar]
- Zhang, B., Liang, E. W., Page, K. L., et al. 2007a, ApJ, 655, 989 [NASA ADS] [CrossRef] [Google Scholar]
- Zhang, B., Zhang, B.-B., Liang, E.-W., et al. 2007b, ApJ, 655, L25 [NASA ADS] [CrossRef] [Google Scholar]
- Zhang, Z. B., Zhang, C. T., Zhao, Y. X., et al. 2018a, PASP, 130, 054202 [NASA ADS] [CrossRef] [Google Scholar]
- Zhang, B.-B., Zhang, B., Castro-Tirado, A. J., et al. 2018b, Nat. Astron., 2, 69 [NASA ADS] [CrossRef] [Google Scholar]
- Zhang, B.-B., Zhang, B., Sun, H., et al. 2018c, Nat. Commun., 9, 447 [NASA ADS] [CrossRef] [Google Scholar]
- Zhang, X. L., Zhang, C. T., Li, X. J., et al. 2020a, Res. Astron. Astrophys., 20, 201 [Google Scholar]
- Zhang, Z. B., Jiang, M., Zhang, Y., et al. 2020b, ApJ, 902, 40 [NASA ADS] [CrossRef] [Google Scholar]
- Zhang, S.-N., Li, T. P., Lu, F. J., et al. 2020c, Sci. China-Phys. Mech. Astron., 63, 249502 [NASA ADS] [CrossRef] [Google Scholar]
- Zhong, S.-Q., Dai, Z.-G., Cheng, J.-G., et al. 2019, ApJ, 884, 25 [NASA ADS] [CrossRef] [Google Scholar]
Appendix A: Tables
Fitting parameters of all individual pulses in Swift sGRBs.
Characteristic Parameters of Diverse Gamma-ray Segments in sGRBs
All Tables
All Figures
|
Fig. 1. Light curves (15–350 KeV) of five typical sGRBs. The horizontal dashed lines indicates the 3σ confidence level. The vertical dashed lines show the starting and the ending times of the emission target pulses: (a) single pulse; (b) M-loose; (c) M-tight; (d) main peak with precursor; (e) main peak with EE. |
| In the text | |
|
Fig. 2. Observational properties of pulse durations. Panel a: distribution of tdur for 30 segments with Ep measurement; Panel b: Ep plotted against tdur for 30 segments with Ep measurement; Panel c: αPL plotted against tdur for 30 segments. The main peaks are indicated with filled shapes, and the precursors or the EEs with empty shapes. |
| In the text | |
|
Fig. 3. Fp plotted against Sγ for 44 pulses including GRB 170817A in our sample. The olive line denotes the best logarithmic fit. All symbols are same as in Fig. 2. |
| In the text | |
|
Fig. 4. Ep plotted against Sγ for 30 segments including GRB 170817A. The solid olive and dashed blue lines are the best logarithmic fits to the correlation between Sγ and Ep for the sGRBs and lGRBs in Zhang et al. (2020b). All symbols are the same as in Fig. 2. |
| In the text | |
|
Fig. 5. Comparison between Fp of the early and the later pulses in the one-component sGRBs (filled symbols, for two types of DP) and the two-component sGRBs (empty symbols). The three peak flux ratios of Fp, l to Fp, e are shown as the dashed, dotted, and dash-dotted lines for 10, 1, and 1/10, respectively. |
| In the text | |
|
Fig. 6. Comparison between Sγ of the early and the later pulses in the one-component sGRBs (filled symbols, for two types of DP) and the two-component sGRBs (empty symbols). The three peak flux ratios of Sγ, l to Sγ, e are shown as the dashed, dotted, and dash-dotted lines for 10, 1, and 1/10, respectively. |
| In the text | |
Current usage metrics show cumulative count of Article Views (full-text article views including HTML views, PDF and ePub downloads, according to the available data) and Abstracts Views on Vision4Press platform.
Data correspond to usage on the plateform after 2015. The current usage metrics is available 48-96 hours after online publication and is updated daily on week days.
Initial download of the metrics may take a while.