Free Access
Fig. 4.
Download original image
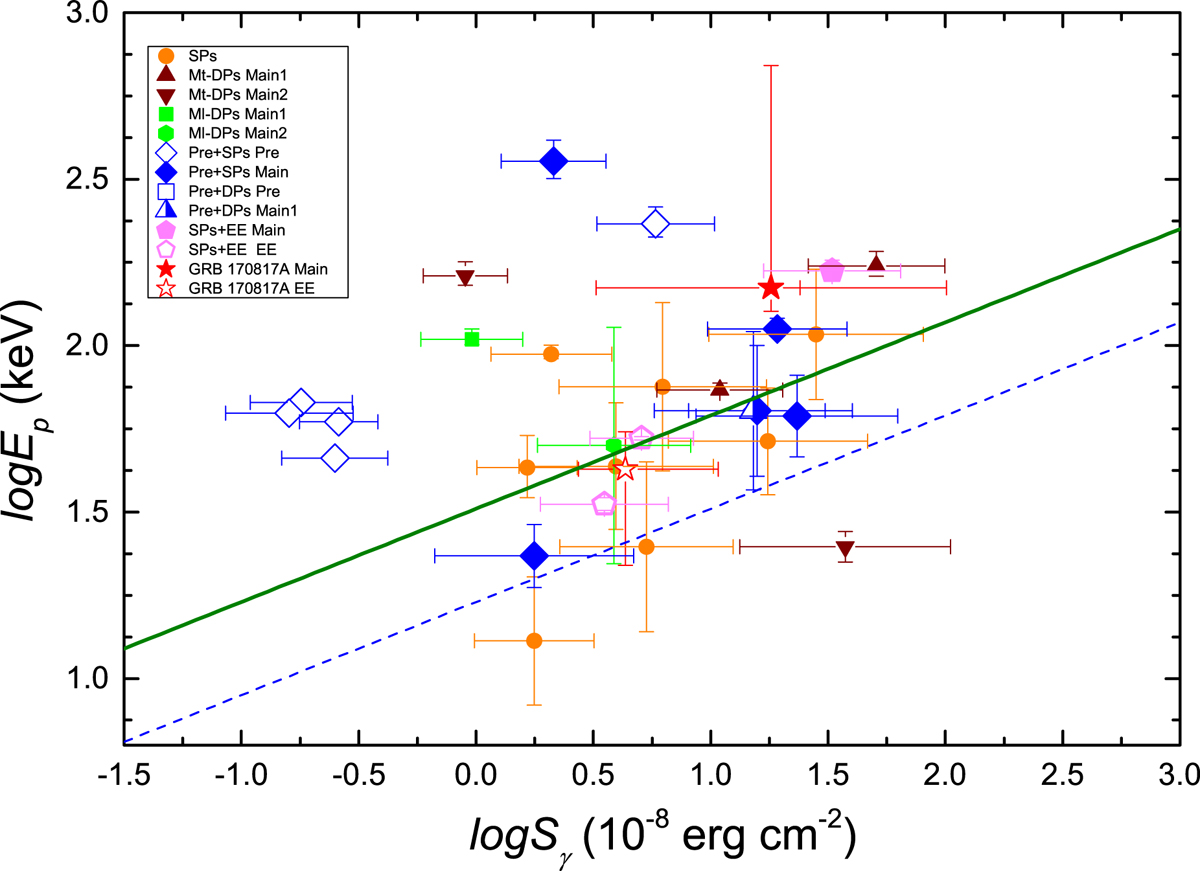
Ep plotted against Sγ for 30 segments including GRB 170817A. The solid olive and dashed blue lines are the best logarithmic fits to the correlation between Sγ and Ep for the sGRBs and lGRBs in Zhang et al. (2020b). All symbols are the same as in Fig. 2.
Current usage metrics show cumulative count of Article Views (full-text article views including HTML views, PDF and ePub downloads, according to the available data) and Abstracts Views on Vision4Press platform.
Data correspond to usage on the plateform after 2015. The current usage metrics is available 48-96 hours after online publication and is updated daily on week days.
Initial download of the metrics may take a while.