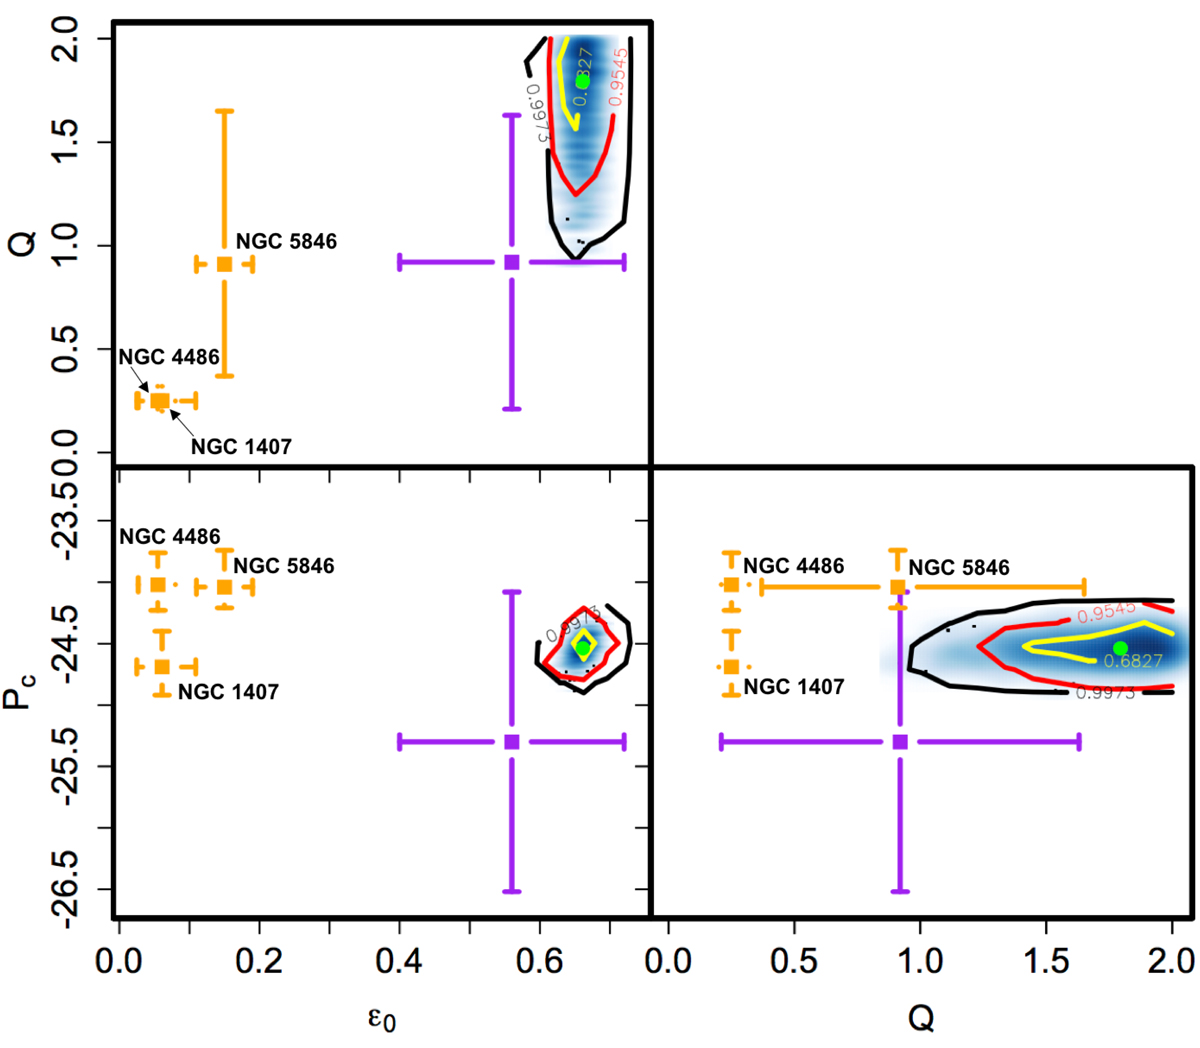
Fig. 9.
Download original image
Permittivity parameters estimated from the three E0 galaxies in our sample (orange squares with error bars) compared with the permittivity parameters estimated by Cesare et al. (2020) from the DMS disk galaxies. The purple squares with error bars show the means of the permittivity parameters found for the individual DMS galaxies. The light blue shaded areas show the posterior distributions of the three permittivity parameters found with an approximate procedure from the entire DMS sample, with the green dots indicating their median values and the yellow, red, and black contours indicating the 1σ, 2σ, and 3σ levels, respectively.
Current usage metrics show cumulative count of Article Views (full-text article views including HTML views, PDF and ePub downloads, according to the available data) and Abstracts Views on Vision4Press platform.
Data correspond to usage on the plateform after 2015. The current usage metrics is available 48-96 hours after online publication and is updated daily on week days.
Initial download of the metrics may take a while.