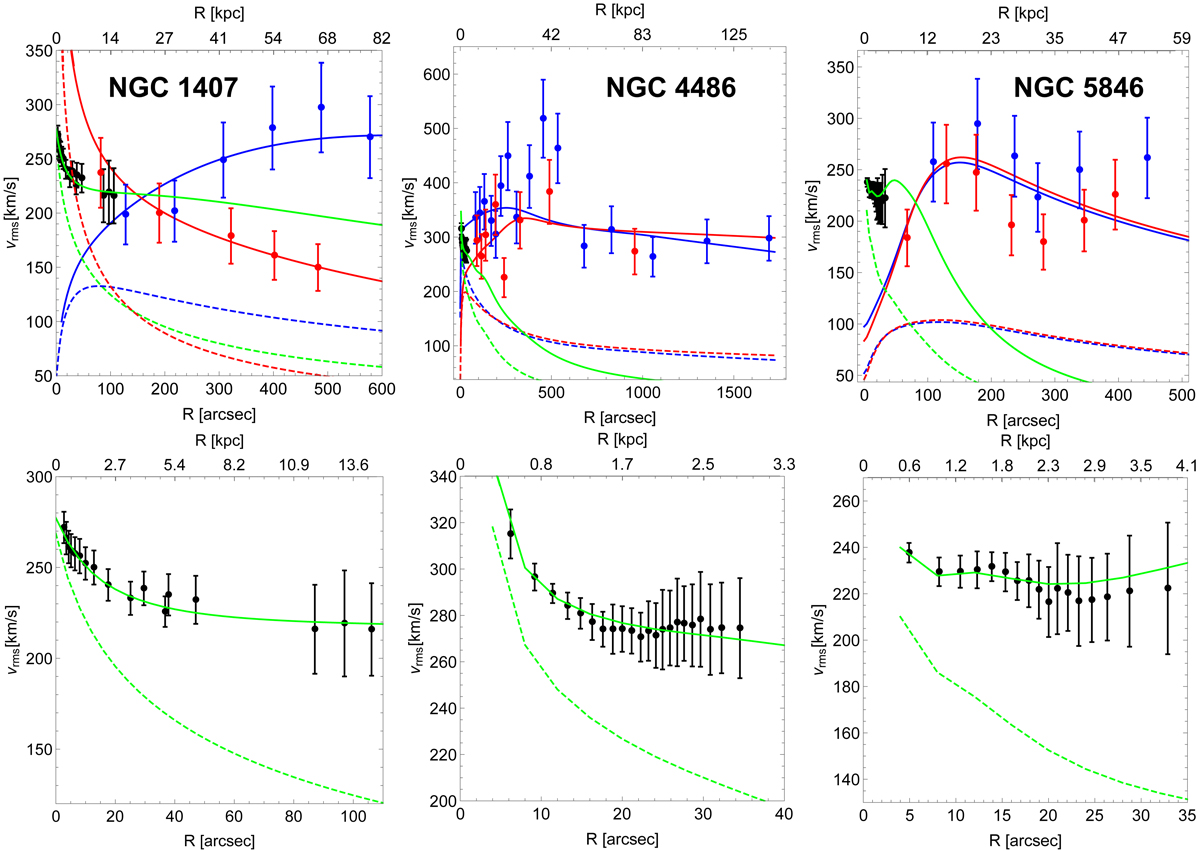
Fig. 8.
Download original image
Models of the root-mean-square velocity dispersion profiles emerging from our MCMC analysis in RG (solid lines). Upper panels: the green, blue, and red solid lines show the model profiles for the stars, blue GCs, and red GCs, respectively. Lower panels: zoom-in of the stellar profiles. The solid circles with error bars are the measured profiles from Fig. 3. The green, blue, and red dashed lines show the kinematic profiles of the stars, blue GCs, and red GCs computed with Eq. (23) where the values of the mass-to-light ratio Υ and the velocity anisotropy parameters β are those of the RG model but the gravitational field is Newtonian with no dark matter. The discrepancy with the RG curves highlights the gravitational boosting generated by the RG gravitational permittivity.
Current usage metrics show cumulative count of Article Views (full-text article views including HTML views, PDF and ePub downloads, according to the available data) and Abstracts Views on Vision4Press platform.
Data correspond to usage on the plateform after 2015. The current usage metrics is available 48-96 hours after online publication and is updated daily on week days.
Initial download of the metrics may take a while.