Fig. 4.
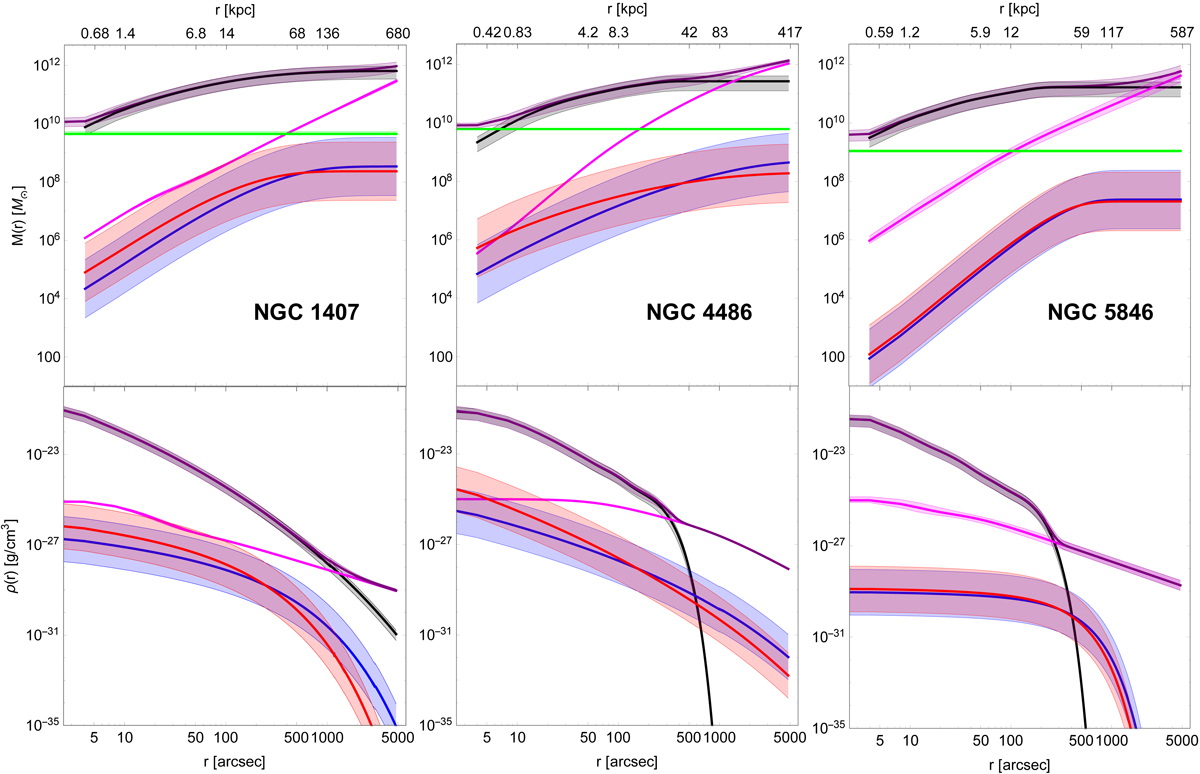
Download original image
Cumulative mass (upper panels) and mass density (lower panels) profiles of the baryonic components of each galaxy: stars (black solid line), blue GCs (blue solid line), red GCs (red solid line), and hot X-ray emitting gas (magenta solid line); the green solid lines in the upper panels show the SMBH contributions. The purple solid lines show the sum of all the baryonic contributions. The stellar profiles assume Υ = 7.6 M⊙/L⊙ for NGC 1407, and Υ = 3.6 M⊙/L⊙ for NGC 4486 and NGC 5846. The grey shaded area around the stellar profiles shows the mass variation by adopting mass-to-light ratios in the range [4.0, 11.2] M⊙/L⊙, for NGC 1407, and [1.7, 5.5] M⊙/L⊙, for NGC 4486 and NGC 5846, in the B- and r-band, respectively. The profiles of blue and red GCs assume a GC mass MGC = 105 M⊙; the blue and red shaded areas show the mass variation by adopting MGC in the range [104, 106] M⊙. The magenta shaded areas show the uncertainties on the adopted gas mass density profiles; the gas profiles of NGC 4486 do not have a shaded area because the uncertainties on the profiles are unavailable. The green solid lines and shaded areas in the upper panels are the masses of the SMBH and their uncertainties. The purple shaded areas show the possible range of the total baryonic profiles. Each column refers to the galaxy indicated in the upper panels.
Current usage metrics show cumulative count of Article Views (full-text article views including HTML views, PDF and ePub downloads, according to the available data) and Abstracts Views on Vision4Press platform.
Data correspond to usage on the plateform after 2015. The current usage metrics is available 48-96 hours after online publication and is updated daily on week days.
Initial download of the metrics may take a while.