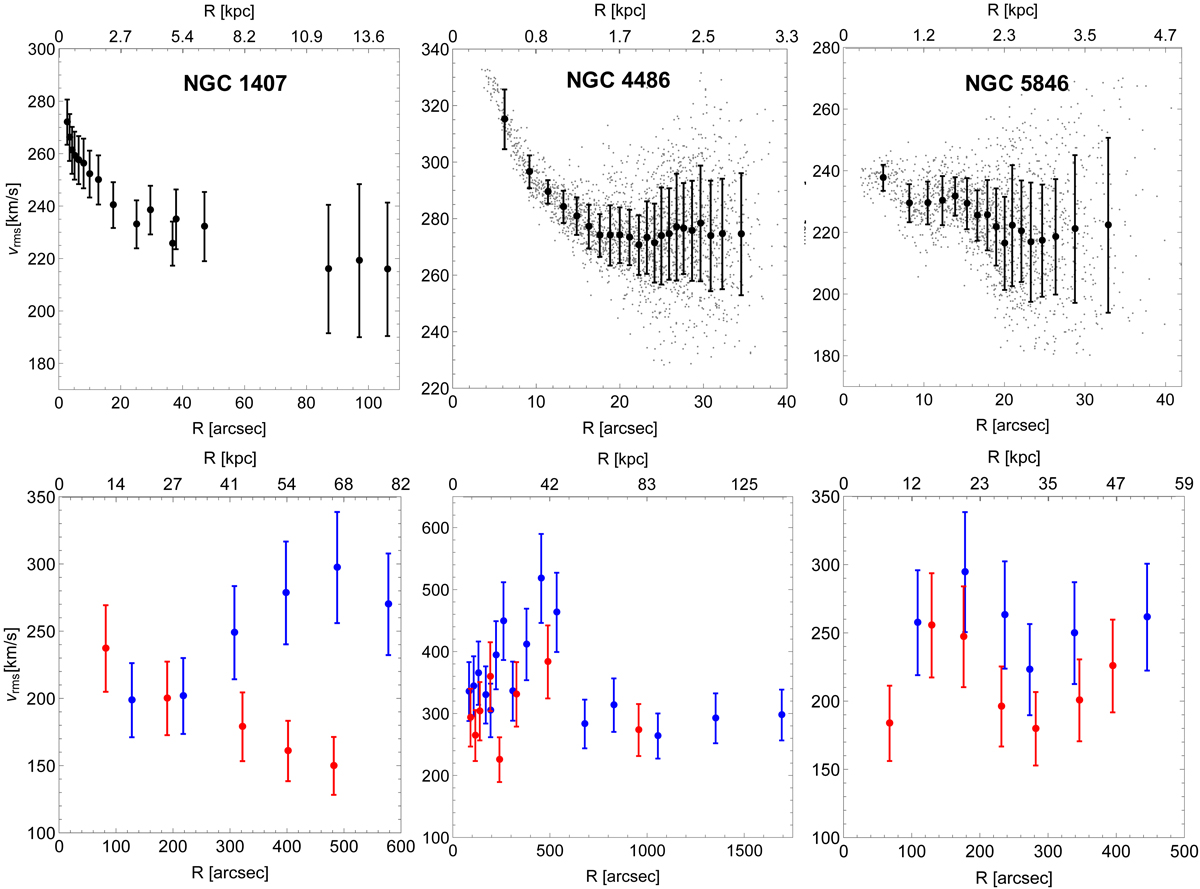
Fig. 3.
Download original image
Root-mean-square velocity dispersion profiles of the stars (upper panels) and of the GCs (lower panels). Each column refers to the galaxy indicated in the upper panels. Upper middle and right panels: grey dots and black dots with error bars show the unbinned and binned profiles, respectively. Lower panels: red and blue dots with error bars refer to the blue and red GC populations, respectively. We note the different radial and velocity ranges of the panels.
Current usage metrics show cumulative count of Article Views (full-text article views including HTML views, PDF and ePub downloads, according to the available data) and Abstracts Views on Vision4Press platform.
Data correspond to usage on the plateform after 2015. The current usage metrics is available 48-96 hours after online publication and is updated daily on week days.
Initial download of the metrics may take a while.