Free Access
Fig. 1.
Download original image
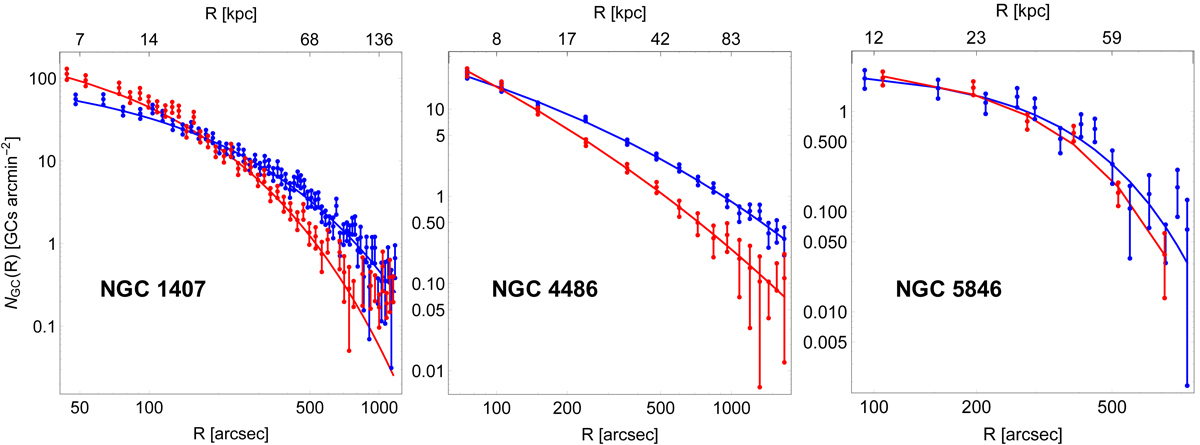
Surface number density profiles of blue (blue symbols and blue lines) and red (red symbols and red lines) GCs. Blue and red dots with error bars show the binned profiles; the solid lines are the models.
Current usage metrics show cumulative count of Article Views (full-text article views including HTML views, PDF and ePub downloads, according to the available data) and Abstracts Views on Vision4Press platform.
Data correspond to usage on the plateform after 2015. The current usage metrics is available 48-96 hours after online publication and is updated daily on week days.
Initial download of the metrics may take a while.