Fig. 7.
Download original image
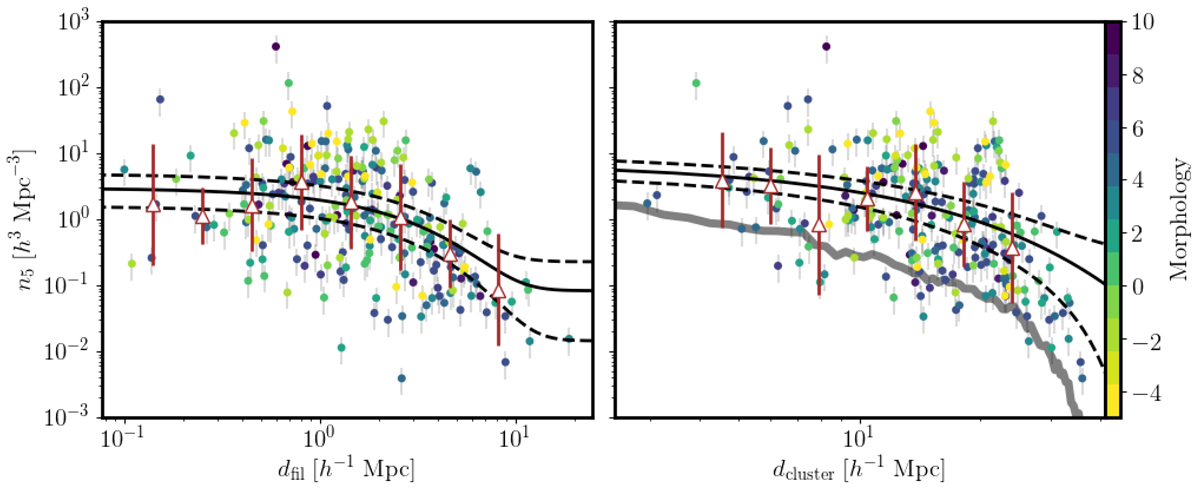
Density profile for filament sources in our sample as a function of the distance from the filament spine (left) and from the Virgo cluster center (right). Sources are color-coded according to their morphological de Vaucouleurs classification. The solid lines show the best fit to the data performed with the exponential model described in the text and estimated at the median distances ⟨dcluster⟩ (left) and ⟨dfil⟩ (right). Dashed lines denote the ±1σ uncertainties to the fit. Triangles show the binned median values, while their error bars correspond to the rms dispersion around the median; equally spaced bins, in log scale, with at least five points each have been considered. Right panel: gray solid line shows the average field density estimated in consecutive spherical shells, concentric with Virgo. Each shell has a radius that is 0.5 h−1 Mpc higher than the previous one.
Current usage metrics show cumulative count of Article Views (full-text article views including HTML views, PDF and ePub downloads, according to the available data) and Abstracts Views on Vision4Press platform.
Data correspond to usage on the plateform after 2015. The current usage metrics is available 48-96 hours after online publication and is updated daily on week days.
Initial download of the metrics may take a while.