Fig. C.3.
Download original image
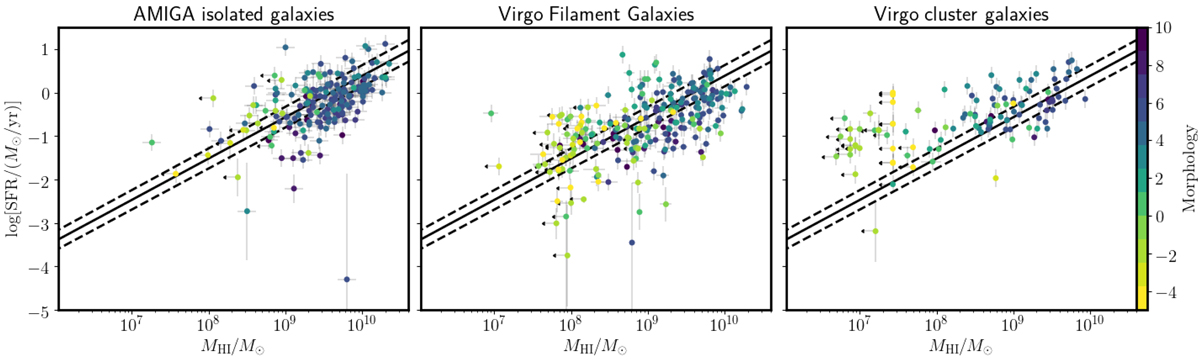
SFR vs. HI mass scatter plot for the Virgo filament sources in our sample (center), AMIGA isolated galaxies (left), and Virgo cluster galaxies (right). Sources are color-coded according to their morphological classification. Solid and dashed lines correspond to the local prescription and model uncertainties by De Looze et al. (2020) for MS galaxies.
Current usage metrics show cumulative count of Article Views (full-text article views including HTML views, PDF and ePub downloads, according to the available data) and Abstracts Views on Vision4Press platform.
Data correspond to usage on the plateform after 2015. The current usage metrics is available 48-96 hours after online publication and is updated daily on week days.
Initial download of the metrics may take a while.