Fig. 5.
Download original image
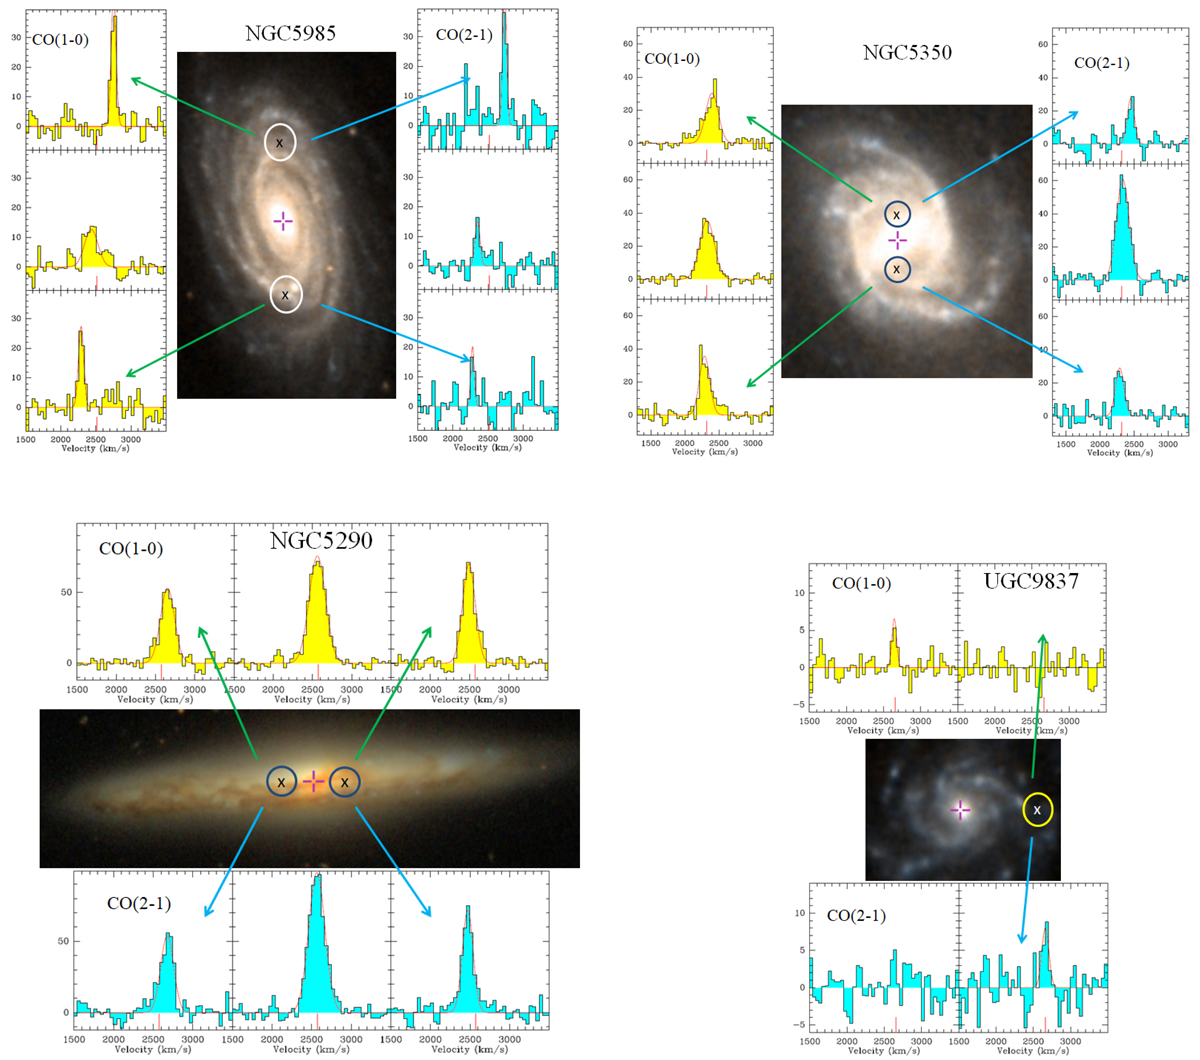
Optical images and IRAM-30 m spectra of the four sources in our sample with multiple pointings. In the images, north is up, east is left, while the crosses in magenta (+) and black/white (×) correspond to the central and offset pointings, respectively. The circles correspond to the CO(2 → 1) beams of 10.5″ each, with the exception of NGC 5985, for which the CO(1 → 0) beams of 21″ each are instead reported. The reported spectra are baseline-subtracted, and the x- and y-axes show the relative velocity and Tmb (in mK), respectively. The solid lines in the spectra are the Gaussian fits to the CO(1 → 0) and CO(2 → 1) lines.
Current usage metrics show cumulative count of Article Views (full-text article views including HTML views, PDF and ePub downloads, according to the available data) and Abstracts Views on Vision4Press platform.
Data correspond to usage on the plateform after 2015. The current usage metrics is available 48-96 hours after online publication and is updated daily on week days.
Initial download of the metrics may take a while.