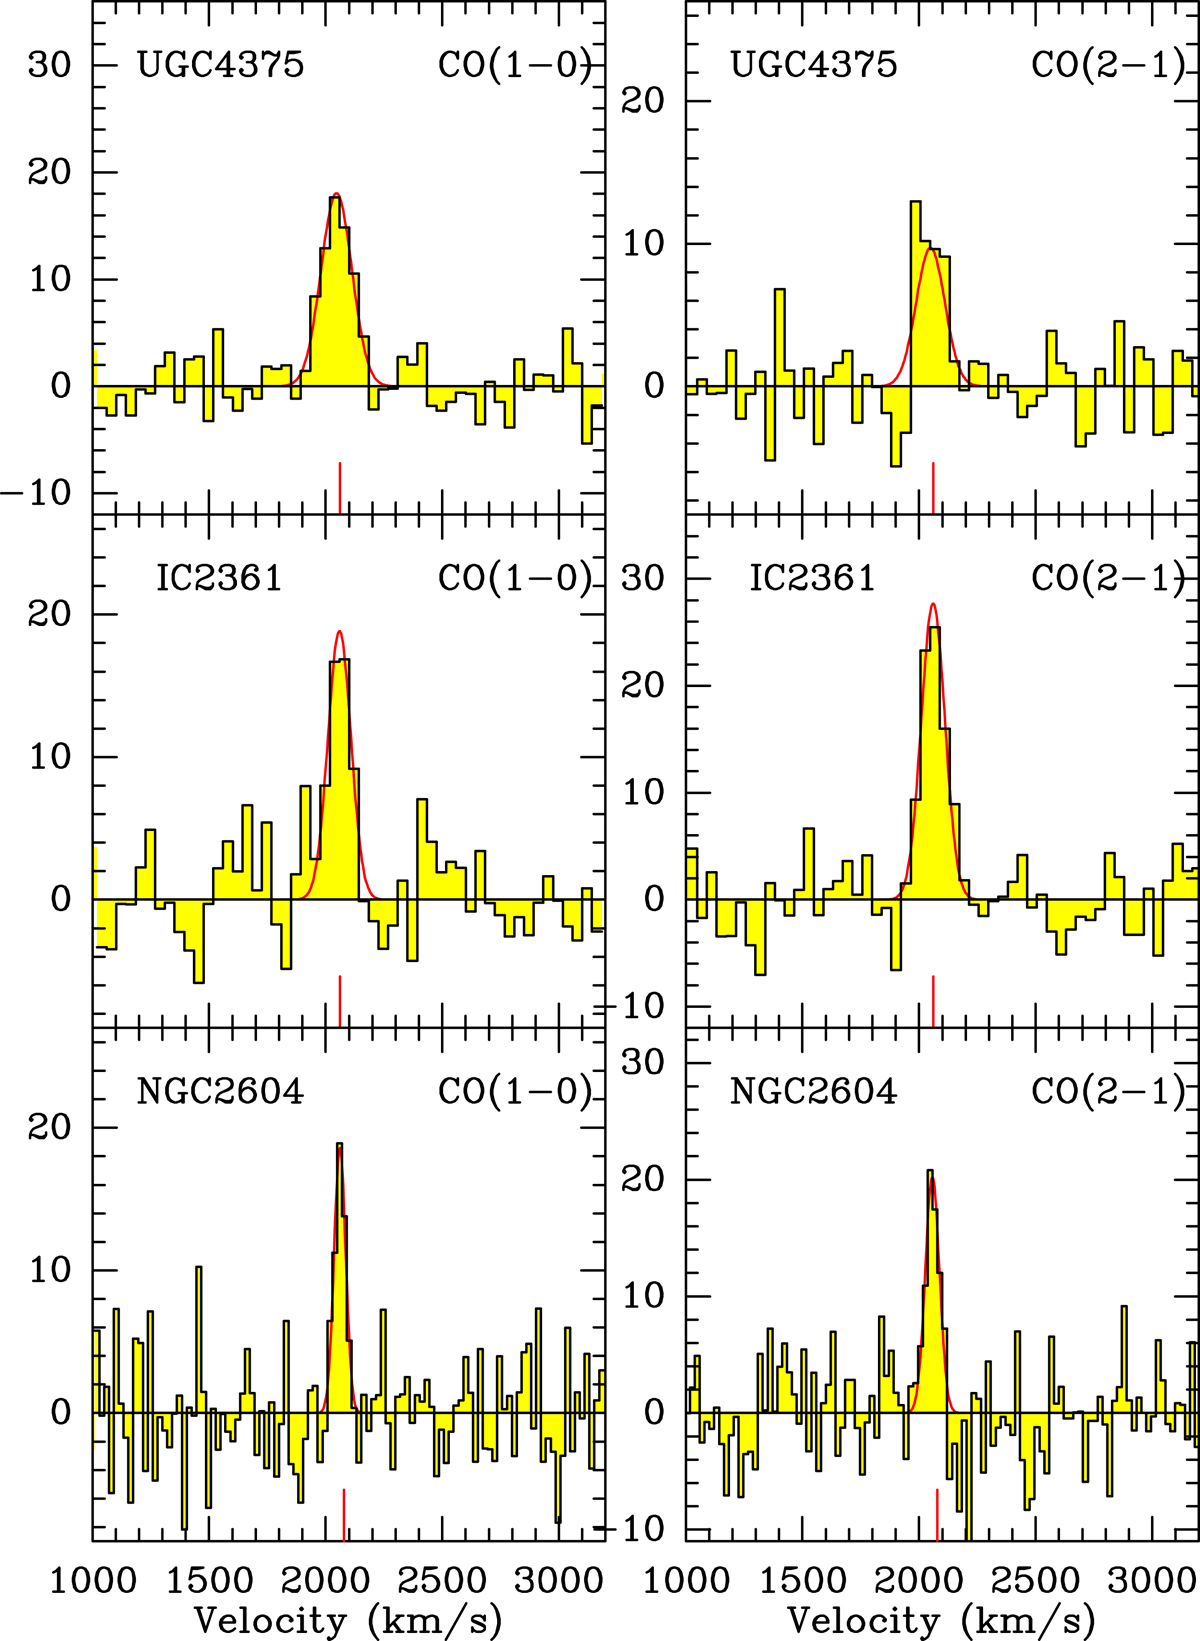
Fig. B.1.
Download original image
Baseline subtracted CO(1→0) (left) and CO(2→1) (right) spectra from our IRAM-30 m campaign for the sources with secure or tentative detections in CO. For each spectrum, the x-axis displays the relative velocity, where the vertical red segment shows the heliocentric velocity of the galaxy. In the y-axis Tmb is shown in units of mK. Solid red curves show the single Gaussian fits to the CO(1→0) and CO(2→1) lines. Three Gaussian components are adopted to fit the CO(1→0) emission of NGC 5311. For the following sources two heliocentric velocities are shown with the vertical segments. The CO emission observed from NGC 2799 is consistent with the source recession velocity of ∼1870 km/s from the optical. Monnier Ragaigne et al. (2003) report instead a lower velocity of 1673 km/s inferred from their HI spectrum taken at the Nançay telescope. However, this HI redshift might not be reliable because of confusion, as also noted by these latter authors. Both optical and radio velocities are nevertheless reported with vertical segments. Similarly, for PGC 214137, i.e., UGC 08656 NOTES01, we report both its recession velocity 2715 km/s and that 2865 km/s of its more massive companion UGC 08656.
Current usage metrics show cumulative count of Article Views (full-text article views including HTML views, PDF and ePub downloads, according to the available data) and Abstracts Views on Vision4Press platform.
Data correspond to usage on the plateform after 2015. The current usage metrics is available 48-96 hours after online publication and is updated daily on week days.
Initial download of the metrics may take a while.