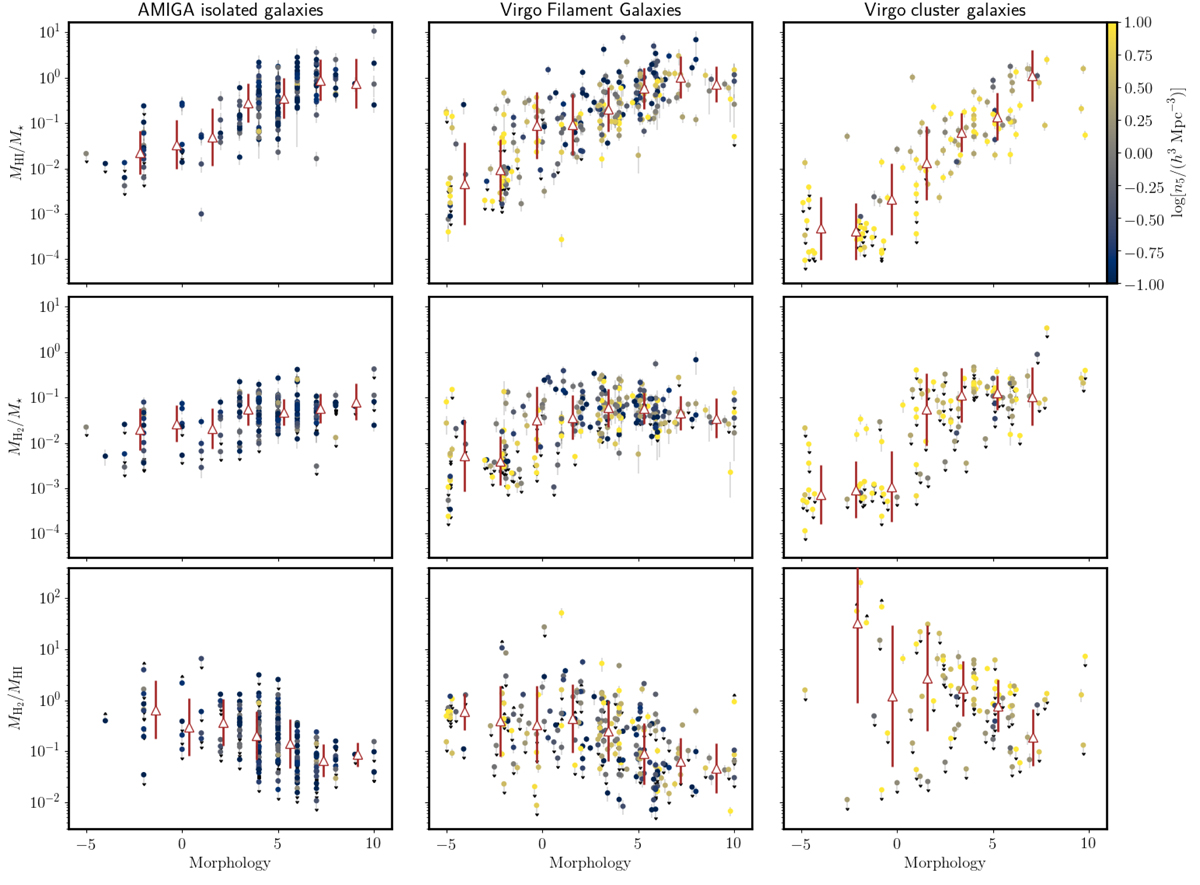
Fig. 13.
Download original image
From top to bottom: MHI/M⋆, MH2/M⋆, and MH2/MHI as a function of morphology for Virgo filament galaxies (center), AMIGA isolated galaxies (left), and Virgo cluster galaxies (right). Points are color coded according to local density n5. Triangles show the binned median values, while their error bars correspond to the rms dispersion around the median; equally spaced bins with at least five points each have been considered. In the bottom row, we do not plot a source if both the HI and H2 masses are upper limits.
Current usage metrics show cumulative count of Article Views (full-text article views including HTML views, PDF and ePub downloads, according to the available data) and Abstracts Views on Vision4Press platform.
Data correspond to usage on the plateform after 2015. The current usage metrics is available 48-96 hours after online publication and is updated daily on week days.
Initial download of the metrics may take a while.