Fig. 1.
Download original image
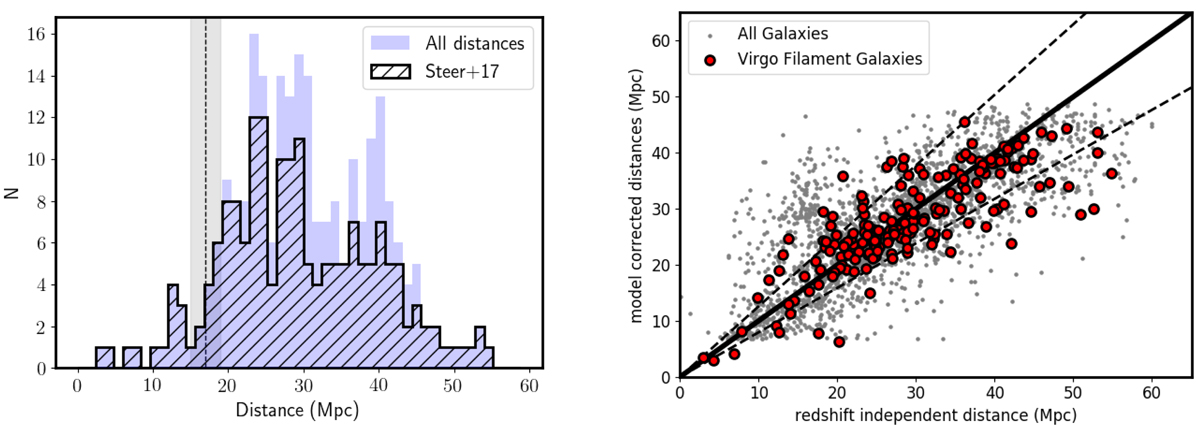
Left: distribution of distances for the 245 sources of our sample. Redshift-independent distances (Steer et al. 2017) are reported in the foreground (dashed histogram), while in the background (blue filled histogram) we report all adopted distances, including those that are model-corrected. The vertical dashed line shows the Virgo cluster distance, while the gray vertical rectangle corresponds to the ±r200 region. Right: scatter plot with model-corrected distances (y-axis) vs. redshift-independent distances (x-axis). Red points refer to our sample of 245 filament galaxies, gray points refer to galaxies in the field of Virgo at distances in the range ∼(0–60) Mpc. The solid black line shows the one-to-one relation, while the dashed lines correspond to an rms = 0.1 dex.
Current usage metrics show cumulative count of Article Views (full-text article views including HTML views, PDF and ePub downloads, according to the available data) and Abstracts Views on Vision4Press platform.
Data correspond to usage on the plateform after 2015. The current usage metrics is available 48-96 hours after online publication and is updated daily on week days.
Initial download of the metrics may take a while.