Fig. 9
Download original image
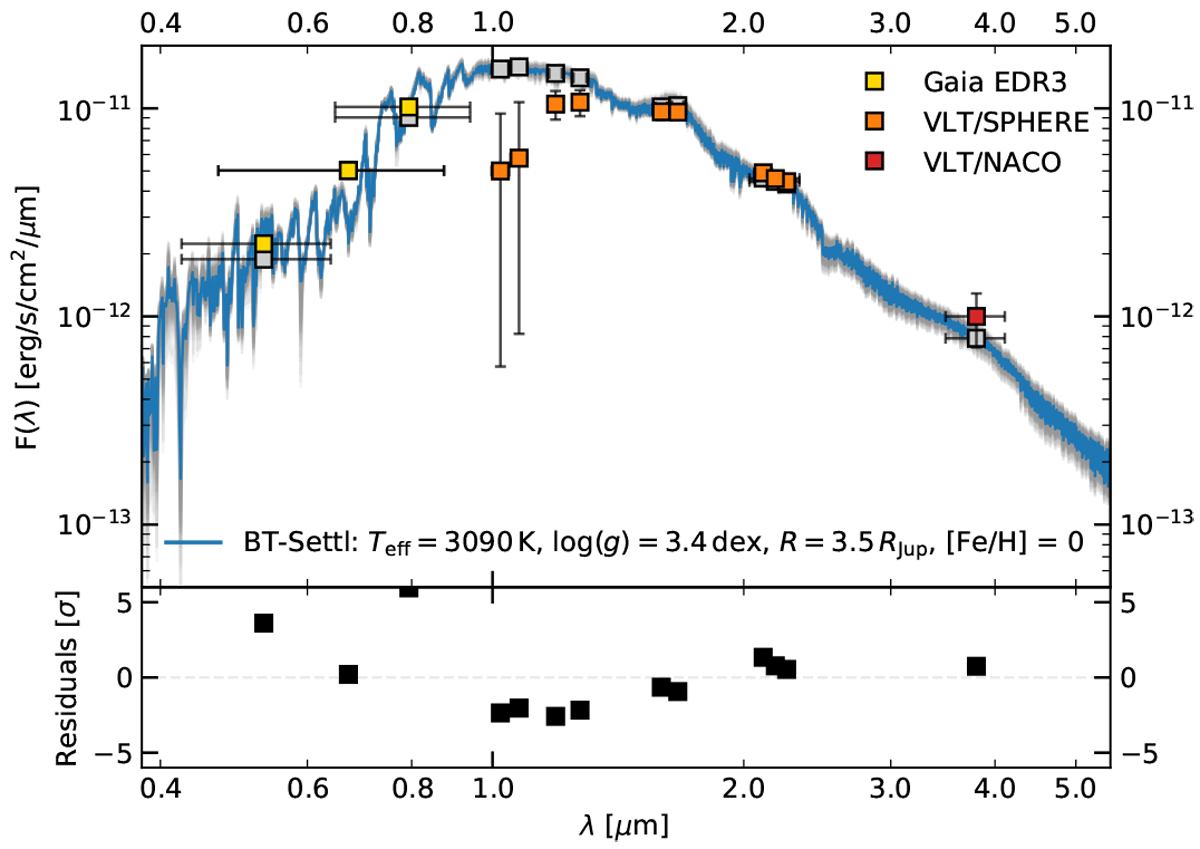
SED of TYC 8252-533-1 B. The yellow, orange, and red squares indicate the photometry we measured for Gaia, SPHERE, and NACO filters, respectively. The bars in the x direction indicate the width of the filter transmission curves. The blue curve presents the median model from our posterior distribution of the SED fit as shown in Fig. D.1. We present the integrated flux of this median model in the applied filters with the grey squares and we visualize 100 randomly selected models from our posterior distribution as grey curves. In the bottom panel, we present the residuals of the fit.
Current usage metrics show cumulative count of Article Views (full-text article views including HTML views, PDF and ePub downloads, according to the available data) and Abstracts Views on Vision4Press platform.
Data correspond to usage on the plateform after 2015. The current usage metrics is available 48-96 hours after online publication and is updated daily on week days.
Initial download of the metrics may take a while.