Fig. 8
Download original image
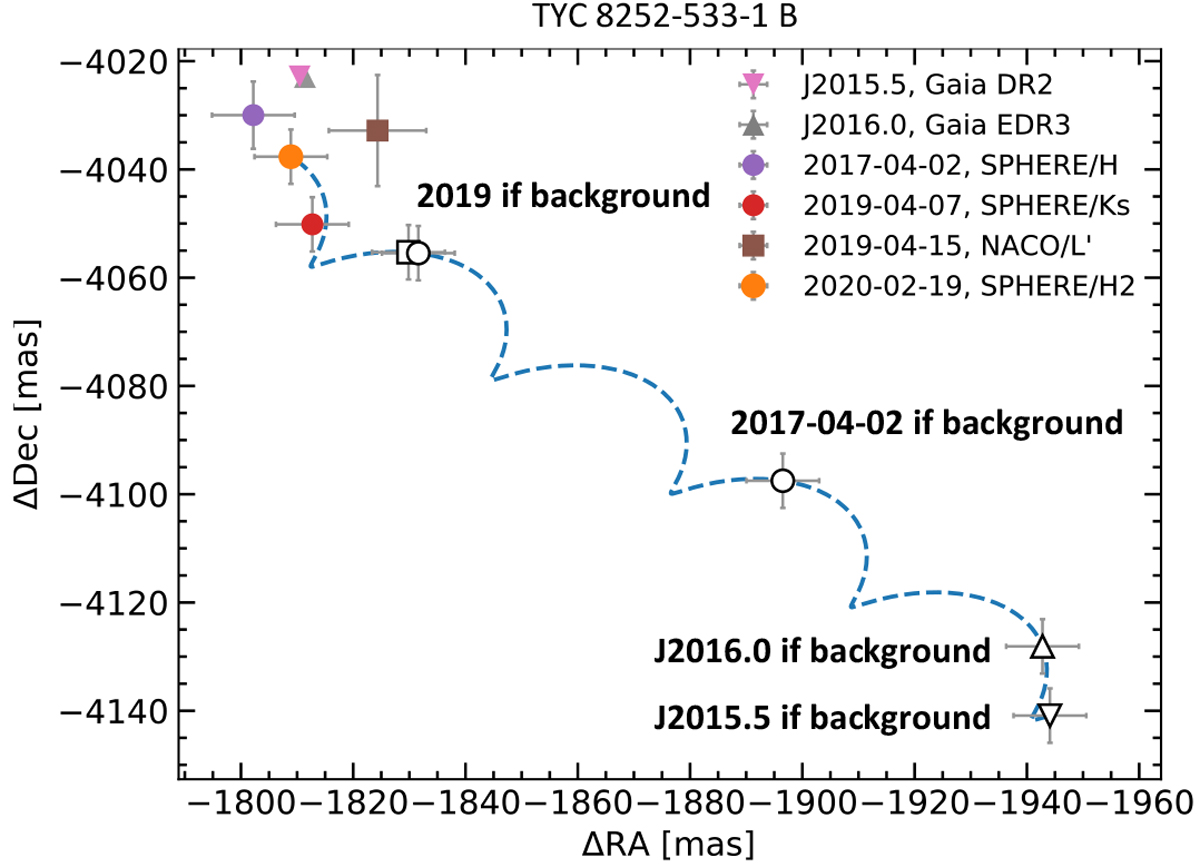
Proper motion analysis of TYC 8252-533-1 B. The colored markers represent the relative offsets in RA and Dec with respect to the primary that we measured in SPHERE and NACO imaging data or derived from the Gaia DR2 and EDR3 catalogs. The blue dashed line illustrates the trajectory of a static background object at infinity and the white markers along the curve represent the hypothetical positions of such an object at the epoch of the corresponding observation.
Current usage metrics show cumulative count of Article Views (full-text article views including HTML views, PDF and ePub downloads, according to the available data) and Abstracts Views on Vision4Press platform.
Data correspond to usage on the plateform after 2015. The current usage metrics is available 48-96 hours after online publication and is updated daily on week days.
Initial download of the metrics may take a while.