Fig. 5.
Download original image
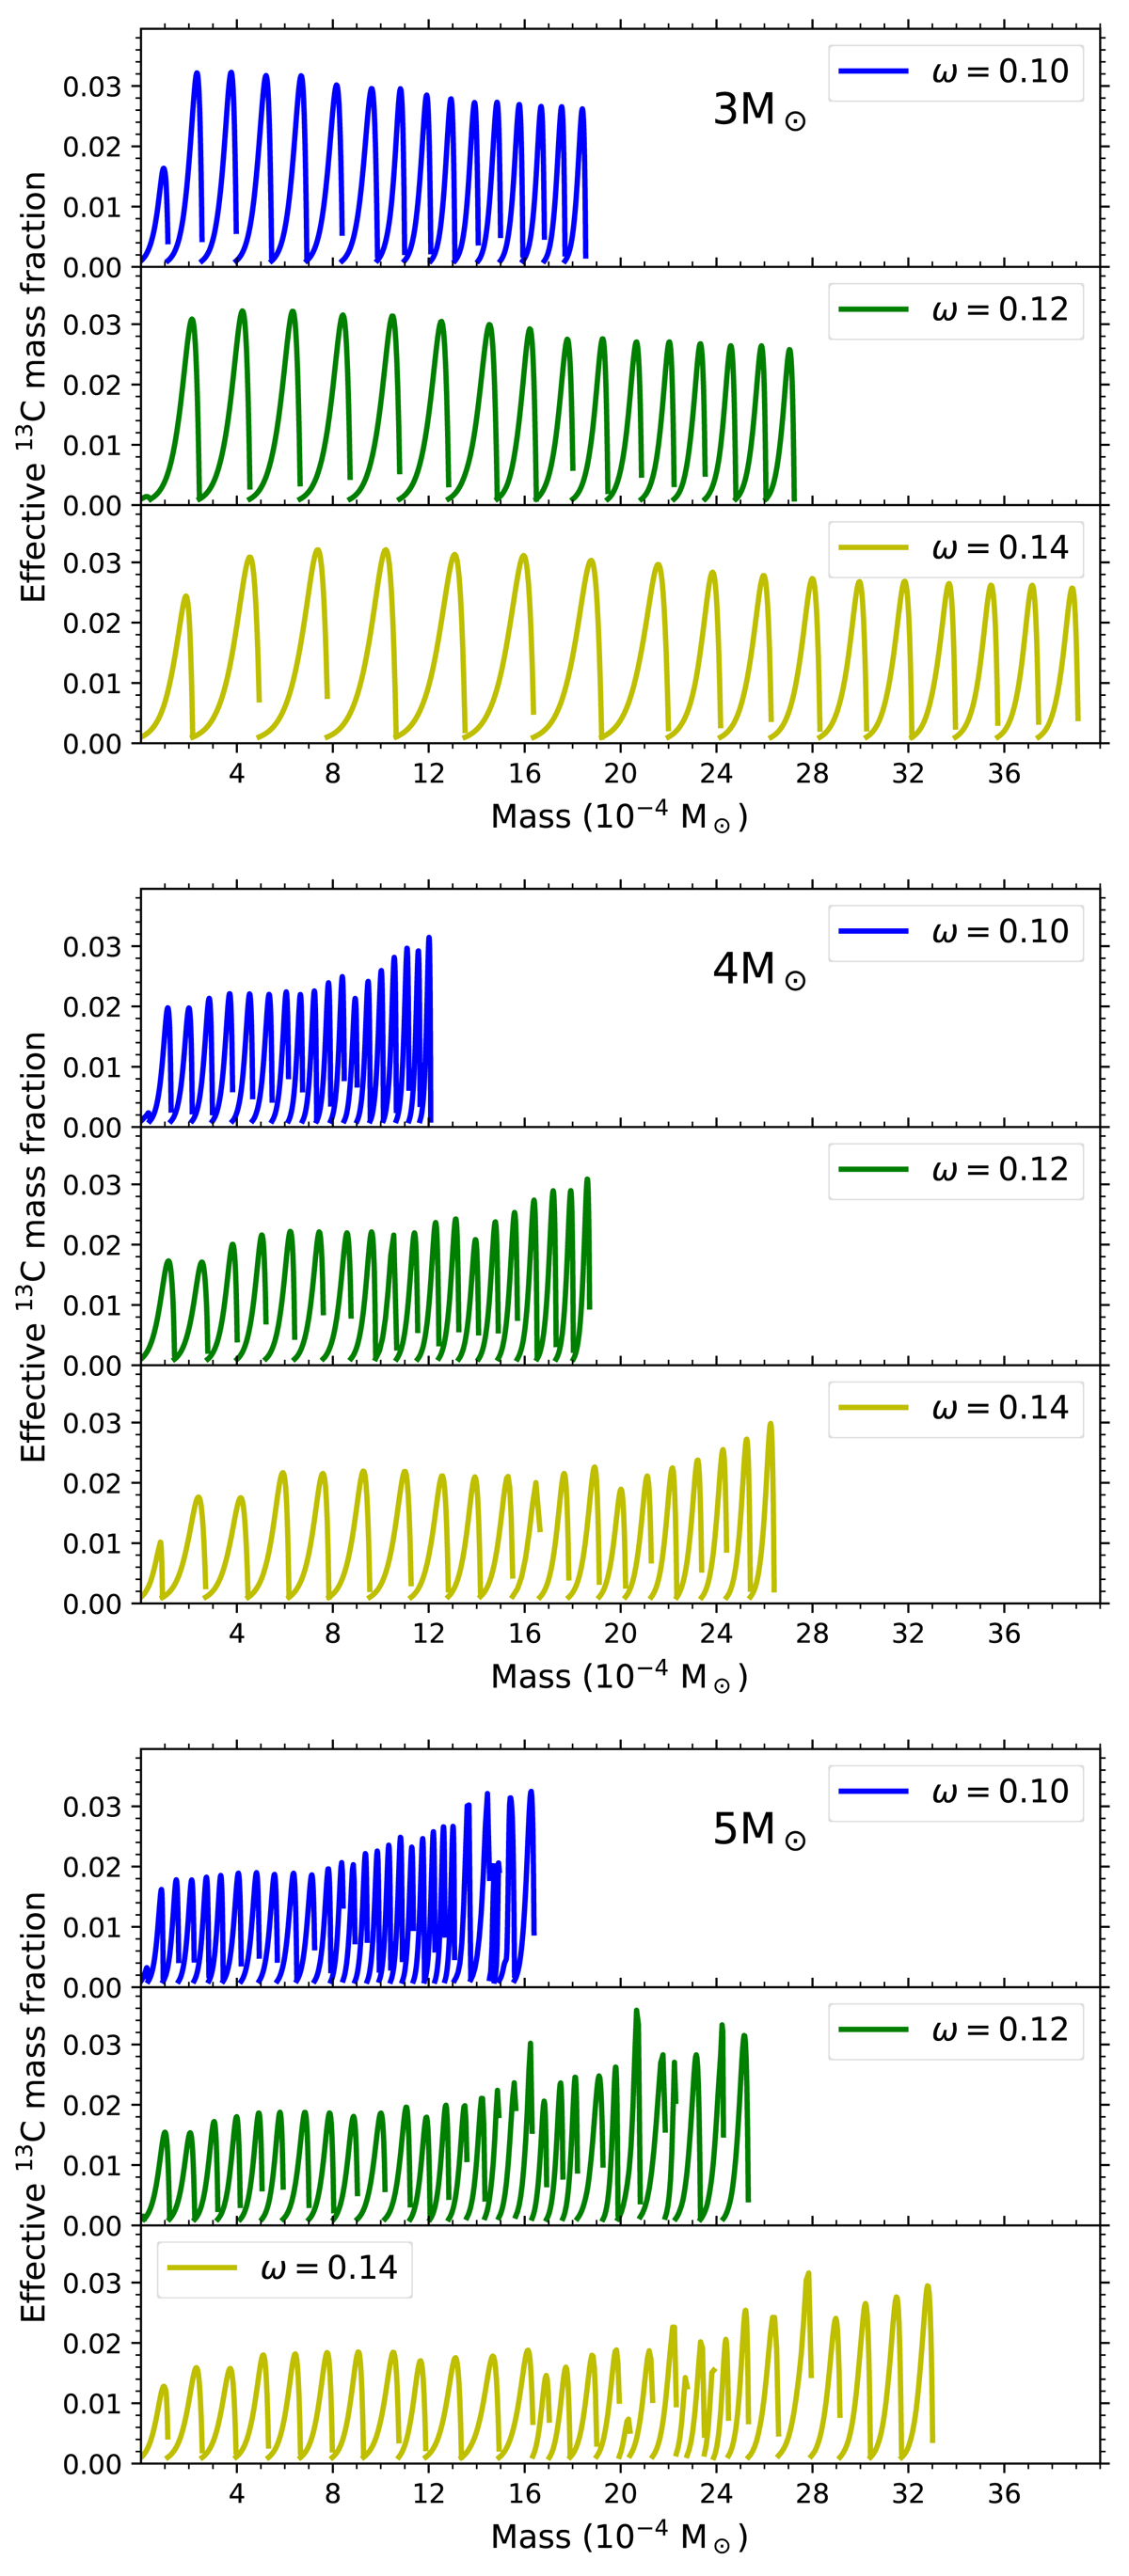
Evolution of the effective 13C pocket in the 3, 4, and 5 M⊙ stars for the overshoot parameters ω = 0.10, 0.12, and 0.14. The y axis shows the mass fraction of effective 13C as defined in Eq. (1), while the x axis shows the width of the pockets in solar masses, with each pocket representing the widest mass extent of the effective 13C pocket in each inter-pulse. This occurs once the protons have burned completely in the He intershell but before the 13C starts to burn. The pockets are artificially arranged, with the earliest inter-pulse to the left to the latest on the right, to show the temporal evolution of their shape and size. There is not a one-to-one correspondence of the number of 13C pockets presented here and the number of TP shown in Fig. 4. This is because a higher ω forces a higher TDU efficiency, forming more 13C pockets.
Current usage metrics show cumulative count of Article Views (full-text article views including HTML views, PDF and ePub downloads, according to the available data) and Abstracts Views on Vision4Press platform.
Data correspond to usage on the plateform after 2015. The current usage metrics is available 48-96 hours after online publication and is updated daily on week days.
Initial download of the metrics may take a while.