| Issue |
A&A
Volume 657, January 2022
|
|
|---|---|---|
| Article Number | A27 | |
| Number of page(s) | 11 | |
| Section | Stellar structure and evolution | |
| DOI | https://doi.org/10.1051/0004-6361/202037789 | |
| Published online | 24 December 2021 | |
A Kepler K2 view of subdwarf A-type stars
1
Department of Astrophysics, Vienna University, Türkenschanzstraße 17, 1180 Vienna, Austria
2
Department of Theoretical Physics and Astrophysics, Masaryk University, Kotlářská 2, 611 37 Brno, Czech Republic
e-mail: This email address is being protected from spambots. You need JavaScript enabled to view it.
3
Institut für Physik und Astronomie, Universitätsstandort Golm, Karl-Liebknecht-Str. 24/25, 14467 Potsdam, Germany
4
Department of Physics, University of Warwick, Coventry CV4 7AL, UK
Received:
21
February
2020
Accepted:
28
September
2021
Abstract
Context. The spectroscopic class of subdwarf A-type (sdA) stars has come into focus in recent years because of their possible link to extremely low-mass white dwarfs, a rare class of objects resulting from binary evolution. Although most sdA stars are consistent with metal-poor halo main-sequence stars, the formation and evolution of a fraction of these stars are still matters of debate.
Aims. The identification of photometric variability can help to put further constraints on the evolutionary status of sdA stars, in particular through the analysis of pulsations. Moreover, the binary ratio, which can be deduced from eclipsing binaries and ellipsoidal variables, is important as input for stellar models. In order to search for variability due to either binarity or pulsations in objects of the spectroscopic sdA class, we have extracted all available high precision light curves from the Kepler K2 mission.
Methods. We have performed a thorough time series analysis on all available light curves, employing three different methods. Frequencies with a signal-to-noise ratio higher than four have been used for further analysis.
Results. From the 25 targets, 13 turned out to be variables of different kinds (i.e., classical pulsating stars, ellipsoidal and cataclysmic variables, eclipsing binaries, and rotationally induced variables). For the remaining 12 objects, a variability threshold was determined.
Key words: subdwarfs / white dwarfs / binaries: general / stars: evolution / stars: variables: general
© ESO 2021
1. Introduction
White dwarfs (WDs) are the final evolutionary state of stars with initial masses of less than about 9 M⊙ (Lauffer et al. 2018). For the evolution of single stars, the minimum mass of a WD is around 0.40 M⊙ (Kilic et al. 2007). Stars on the main sequence with lower masses have an evolution time greater than the age of the Universe. Considering the mass-radius relation of WDs, such masses correspond to a minimal log g of about 6.5. On the other hand, the maximum log g of main-sequence A-type stars is about 4.75 in the case of low metallicities. This limit is even lower for higher metallicity because of its radius dependence (e.g., Romero et al. 2015).
Binary evolution can lead to objects having log g values between 6.5 and 4.75 (Istrate et al. 2016; Vos et al. 2018). One scenario is that binary interaction strips away the star’s outer layers during core He burning, resulting in a hot, lower-mass object known as a hot subdwarf (see Heber 2016, for a thorough review on these objects). This mechanism works only for a certain mass regime because, for stars with masses lower than 2 M⊙, the temperature for burning He is only reached after they become degenerate (Langer 2004). As a consequence, if the outer layers of a low-mass progenitor are stripped away before the He burning starts, a degenerate He core with a hydrogen atmosphere will be left: a WD. Because the mass of the WDs that result from this mechanism can be much lower than the single star evolution limit, they are known as extremely low-mass WDs (ELMs; Brown et al. 2020), which have 4.5 < log g < 7.0. Their precursors, pre-ELMs, can have even lower values of log g before they reach the cooling track. Due to rotational mixing, they can also show atmospheric metals (Istrate et al. 2016). Hence, the spectra of (pre-)ELMs can resemble the spectra of low-metallicity main-sequence A-type stars very closely.
The result is that the evolutionary status of objects that show metal-poor hydrogen-dominated spectra with log g in the range 4–6 (taking the large uncertainties due to line blanketing into account; Brown et al. 2017; Pelisoli et al. 2018a) cannot be determined from spectroscopy alone. These objects are grouped into the spectroscopy class of subdwarf A-type (sdA) stars, given that they are located below the canonical (solar metallicity) main sequence (Kepler et al. 2016). In a series of papers (Pelisoli et al. 2019), we have attempted to shed light on the evolutionary nature of stars within the sdA spectral class. Recently, Yu et al. (2019) have shown, using population synthesis models, that most sdA stars are consistent with metal-poor main-sequence stars, in agreement with previous works. The fraction of (pre-)ELMs can vary from 0.1% to 20%, depending on the age of the population.
In summary, the physical properties of sdA stars are basically consistent with four different scenarios: (a) pre-ELMs or ELMs; (b) blue-stragglers; (c) metal-poor late-type main-sequence stars; and (d) hot subdwarfs plus main-sequence F, G, K binaries (Pelisoli et al. 2018a).
Investigating the properties of the light curves of sdA stars offers an independent probe into their evolutionary origin (e.g., Bell et al. 2018). Depending on the evolutionary status of the sdA stars, they can be located, for example, within the classical pulsational instability strip. Our main aim is to study the (non-) variability of this star group in order to shed more light on the evolutionary status of the individual objects.
The long, ultra-precise, and well-sampled time series data provided by space missions, such as the CoRoT (Baglin et al. 2009), Kepler (Borucki et al. 2010), or TESS (Vanderspek 2019) satellites, have revolutionized the field of variable star research and, in particular, asteroseismology. The detection limit for variability signals has decreased dramatically, which has enabled the first detailed investigations and classifications of variable stars with very low amplitudes and has revealed unprecedented detail and complexity in their light curves.
In this paper we present the time series analysis of 25 stars classified as sdA that were observed by the Kepler K2 mission. We also derive upper limits of non-variability for almost half the objects.
2. Target selection, used data, and data reduction
We used the list of 3891 sdA stars previously identified in the Sloan Digital Sky Survey (SDSS) with available and reliable Gaia Data Release 2 (DR2) astrometric data taken from Pelisoli et al. (2019). This is the best currently available dataset for this spectroscopic class. As the next step, we searched for matches in the complete dataset of the Kepler K2 mission. Kepler was launched in March of 2009; it consists of a 0.95 m Schmidt telescope feeding a 94.6 million pixel 42 charge-coupled device (CCD) detector array and covers a wavelength of 4300 Å to 8400 Å. The Kepler K2 mission began in November of 2013 and continued until 2019; during this period, Kepler was repurposed for a pointed survey of predetermined targets along the ecliptic plane, in contrast to the original fixed Kepler Input Catalog (KIC) stars. K2 typically saved target pixel files (TPFs) of chosen targets and would only download full-frame images (FFIs) twice per campaign. K2 data products were mostly long-cadence TPFs (29.4 min), short-cadence TPFs (1 min), and long-cadence light curves. Each field (115.6 deg2) was observed for approximately 80 d at a time. K2 also boasted a photometric precision of ≈300 parts per million and a pointing stability of approximately 0.66 pixels. K2 observed targets of brightness up to V = 4 mag and down to as low as V = 20 mag with a photometric precision of 10% (at 30 min). The resulting K2 data were saved in the K2 Ecliptic Plane Input Catalog (EPIC), and the light curves used in this paper were all retrieved from this catalogue. In total, there are about 490 000 light curves available. We found 32 light curves for 25 objects, which are listed in Table 1.
Target stars for which Kepler K2 data are available.
For the time series analysis of the light curves, the original and pre-reduced (Vanderburg & Johnson 2014) data were used. The latter take into account that the reduced telescope’s ability to point precisely for extended periods of time has influenced the photometric precision. The reduction technique accounts for the non-uniform pixel response function of the Kepler detectors by correlating flux measurements with the spacecraft’s pointing and removing the dependence. Although there are still artefacts visible, the quality of the light curve and thus the noise level of the data are significantly improved.
All light curves were examined in more detail using the program package PERIOD04 (Lenz & Breger 2005), which performs a discrete Fourier transformation. The results from PERIOD04 were checked with CLEANEST and phase dispersion minimization (PDM) algorithms as implemented in the program package PERANSO (Paunzen & Vanmunster 2016). The same results were obtained within the derived errors, which depend on the time series characteristics (i.e., the distribution of the measurements over time and photon noise). If more than one light curve was available, we checked both of them for the significant frequencies. For all cases, all the significant frequencies were detected in both datasets. This provides confidence that no spurious frequencies or artefacts are present in the analysed light curves.
We also merged the light curves of one object for two or more campaigns and searched for long-term trends. However, this task is extremely restrained by instrumental effects. Montet et al. (2017) described their efforts, starting with the FFIs of the original Kepler mission. We were not able to gain any statistically significant improvements or find convincing long-term trends. Because the time basis of most light curves is about 30 days, we therefore confined our time series analysis to periods of 30 d.
Defining the variability threshold is not straightforward. In general, the statistical significance of the noise in the Fourier spectrum is underestimated. We employed a conservative approach and defined the upper limit of variability as the upper envelope of the peaks in an amplitude spectrum. Because the noise levels change over the frequency range, we derived the values for three regions: 0.03–0.5 c/d, 0.5–2.0 c/d, and 2.0–25 c/d. One example is shown in Fig. 1. The red lines show the deduced limits of (non-)variability for the light curve of EPIC 220489294 (Table 2).
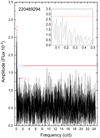 |
Fig. 1. Amplitude spectrum of the apparent non-variable star EPIC 220489294, showing how the variability threshold is defined. |
Results of the time series analysis for all target stars.
To check for known variable stars, we applied the version of the International Variable Star Index (VSX; Watson et al. 2006) available as of January 27, 2020 (1 432 563 included objects). The search radius for objects was 10”. We detected eight objects among our sample (see the last column of Table 1).
The light curves were analysed together with spectra of the Large Sky Area Multi-Object Fiber Spectroscopic Telescope (LAMOST) DR5 (Luo et al. 2019) and the SDSS DR12 (Alam et al. 2015) to constrain the evolutionary status of each sdA star. The LAMOST telescope (Cui et al. 2012) is a reflecting Schmidt telescope located at the Xinglong Observatory in Beijing, China. It boasts an effective aperture of 3.6 to 4.9m and a field of view of 5°. Due to its unique design, LAMOST is able to take 4000 spectra in a single exposure with a spectral resolution R ∼ 1800, a limiting magnitude of about 19 mag in r, and a wavelength coverage from 3700 to 9000 Å. LAMOST is therefore particularly suited to survey large portions of the sky and is dedicated to a spectral survey of the entire available northern sky. LAMOST data products are released to the public in consecutive data releases and can be accessed via the LAMOST spectral archive1. The SDSS uses a dedicated 2.5m wide-field telescope, instrumented with a sequence of sophisticated imagers and spectrographs. The wavelength coverage of the spectra is from 3800 to 9200 Å for the SDSS spectrograph (up to Plate 3586), and 3650 to 10 400 Å for the BOSS spectrograph, with a resolution of 1500 at 3800 Å and 2500 at 9000 Å (Eisenstein et al. 2011).
3. Results
In Table 2 we present all the results of our time series analysis. The detected variable stars among the sdA stars (Table 2) show quite a variety in terms of type (Col. 7 of the table), reflecting the different evolutionary status of the spectral sdA class; this is also clear from their different locations in the Gaia Hertzsprung-Russell diagram (HRD) shown in Fig. 2. All three stars among the high log g (i.e., the WD domain EPIC 220489294, 248407521, and 248833732) are found to be constant. The other non-variable objects are distributed along the complete temperature range. The location of variable objects shows good agreement with their observed variability, considering what we know about the pulsation instability strip and the occurrence of α2 Canum Venaticorum (ACV) variables, as discussed in more detail below.
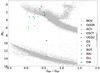 |
Fig. 2. HRD, i.e., MG versus (BP − RP) diagram, of our targets, together with stars from the Sample C presented in Gaia Collaboration (2018) for guidance. The location of our targets together with their variability type is marked with different symbols. ‘NOV’ indicates that the target was ‘not observed to vary’. The remaining acronyms are the same as in Table 2. |
3.1. Astrophysical parameters
Pelisoli et al. (2019) applied a grid of synthetic spectra to the observed ones from the SDSS in order to derive the astrophysical parameters. This method was especially optimized for subdwarfs. We have updated this procedure and checked it with the literature for known WDs (Kleinman et al. 2013; Koester & Kepler 2015).
We compared the astrophysical parameters listed in Table 1 with estimates from the literature. For this, we used the values from Andrae et al. (2018), Anders et al. (2019), and Bai et al. (2019), which are all based on an automatic pipeline and the Gaia DR2. In Fig. 3 the comparison is presented. The Teff values show a wide spread around the line of equality. This is also true if we compare the literature values among themselves. Additionally, due to the rather large uncertainties, most of the data points fall on the identity line in a 2σ range. For the log g values, only Anders et al. (2019) can be used for a comparison. They do not include any WDs in their study. Again, we see a wide spread, which is to be expected. To get more accurate astrophysical parameters, high resolution spectra are needed, which is beyond the scope of this paper.
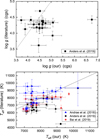 |
Fig. 3. Comparison of the Teff (lower panel) and log g (upper panel) values with those from the literature. The log g values were derived by automatic pipelines (Andrae et al. 2018; Anders et al. 2019; Bai et al. 2019). |
Furthermore, we checked the astrophysical parameters of the three WDs (i.e., EPIC 220489294, 248407521, and 248833732). Because they cover a wide variety of spectral types (DB, DA, and DC), we used different appropriate atmosphere models (Koester 2010) and spectral classifications (Koester et al. 1982). The estimated Teff and log g values were checked with the location in the HRD (Lauffer et al. 2018). No inconsistencies were found.
3.2. Main-sequence and horizontal branch pulsators
3.2.1. EPIC 202066368
Armstrong et al. (2015) classified the light curve of EPIC 202066368 as quasi-periodic with a period of 1.621151 d but did not study the source of the variability. We identify the same dominant period as Armstrong et al. (2015), as well as four other previously unidentified frequencies. Given the effective temperature, observed eigenfrequencies, and light curve characteristics, we identify this star as being a γ Doradus pulsator (Balona et al. 2011). These variables are characterized by a high-order, low-degree, non-radial gravity-mode (g-mode) pulsation (Kaye et al. 1999), which is thought to be driven by the convective flux blocking mechanism (Guzik et al. 2000). They are encountered between spectral types A7 and F7, consistent with the physical parameters found for this object (see Table 1), although other sources have shifted the red border of the corresponding instability strip to somewhat hotter temperatures (spectral type F5; cf. Catelan & Smith 2015, and references therein). The multi-periodic variations are clearly seen in Fig. 4. We employed the empirical pulsation period versus Teff relation derived by Ibanoglu et al. (2018) for 109 γ Doradus stars. It yields a period of about 0.55 d for the Teff taken from Table 1. The found periods are between 0.5475 and 0.6594 d, which perfectly coincidences with the expected value. EPIC 202066368 is therefore a main-sequence γ Doradus pulsator, the first identified among sdA stars.
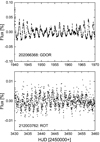 |
Fig. 4. Light curves of the pulsating star EPIC 202066368 (upper panel) and the rotational-induced variability of EPIC 212003762 (lower panel). The multi-periodic variations for EPIC 202066368 are clearly visible. |
3.2.2. EPIC 202067392
This star was included by Smith et al. (2010) in their catalogue of blue horizontal branch stars at a distance of 6.41 kpc from the Sun. With the new Gaia data (Table 1), we now know that this object is much closer (about 3.5 kpc) to the Sun and therefore less luminous than previously thought. Here, we report its variability for the first time. The light curve and found periods are typical for a δ Scuti-type pulsation. They are multi-periodic pulsators of luminosity classes V to III that boast masses between about 1.5 M⊙ < M < 4.0 M⊙ (Aerts et al. 2010). The observed light changes are caused by multiple radial and non-radial low-order pressure modes (p modes), which are excited through the κ mechanism (Handler 2009). In evolved δ Scuti stars, so-called mixed modes are often observed. These are pulsation modes exhibiting g-mode characteristics in the interior and p-mode characteristics near the stellar surface (Bowman et al. 2016). If we take the period luminosity relation from Ziaali et al. (2019), the period with the highest amplitude gives an absolute magnitude of +2.17 mag. Taking the astrophysical parameters from Table 1, we derive a value of about +2 mag with an error of about ±0.3 mag. The main contribution here is the error of the parallax. Because the detected variability is multi-periodic (Fig. 5) within the proper frequency range, we conclude that EPIC 202067392 is a δ Scuti-type pulsator. The high gravity found by Pelisoli et al. (2019) (4.62; see Table 1) is at odds with the fact that this is likely a young object, hence with high metallicity, in agreement with its position in Fig. 2. This can be explained by the fact that Pelisoli et al. (2019) assumed solar metallicity in their fits, leading to high systematic uncertainties in log g.
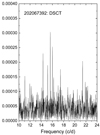 |
Fig. 5. Rich amplitude spectrum of the variable of the δ Scuti-type pulsator EPIC 202067392. The found amplitudes and the noise level are quite small. |
3.2.3. EPIC 212168575
This star has previously been identified as an RR Lyrae star by Sesar et al. (2013), using data from The Lincoln Near-Earth Asteroid Research (LINEAR) survey. We confirm this result with the higher-quality K2 light curve, shown in Fig. 6, which confirms EPIC 212168575 as an RRc variable. Classical RR Lyrae are evolved stars that burn helium in their cores. In the HRD, they are located at the intersection of the horizontal branch and the classical instability strip, in which the κ mechanism operating in the hydrogen and helium partial ionization zones drives the pulsation. RRc stars pulsate in the first overtone radial mode (Plachy et al. 2019). It is important to mention that RR Lyrae-like pulsations can also be observed in pre-ELMs: Because of their complicated evolution, which can involve episodes of residual burning, they can have properties within the RR Lyrae instability strip. There is at least one observed system with such properties (Pietrzyński et al. 2012), with another candidate observed by Bell et al. (2018). The former could be confirmed as a pre-ELM because it is in an eclipsing system, which allowed its mass to be determined as only 0.26 M⊙. We unfortunately detect no eclipses for EPIC 212168575. Considering that Pietrzyński et al. (2012) estimated that only 0.2% of RR Lyrae are pre-ELMs, and that only a small fraction of sdA stars are expected to not be main-sequence stars, we conclude that EPIC 212168575 is likely a classical RR Lyrae star. This, combined with the position in Fig. 1, suggests that the log g estimated by Pelisoli et al. (2019) and quoted in Table 1 is overestimated, illustrating the importance of performing additional analyses other than spectral fitting for sdA stars.
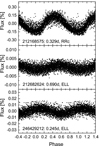 |
Fig. 6. Phased light curves of EPIC 212168575 (upper panel), EPIC 212682624 (middle panel), and EPIC 246429212 (lower panel). |
3.3. A new α2 Canum Venaticorum variable
The light curve of EPIC 202066571, shown in the inset of Fig. 7, resembles that of a classical ACV variable. These are magnetic, chemically peculiar (CP) stars of the upper main sequence that show a non-uniform distribution of chemical elements. This distribution manifests itself in the formation of spots and patches of enhanced element abundance (Michaud et al. 1981), in which flux is redistributed through bound-free and bound-bound transitions. Therefore, as the star rotates (normally below 50 km s−1), strictly periodic changes are observed in the spectra and brightness of many CP stars, which are satisfactorily explained by the oblique rotator model (Stibbs 1950). The light curves are stable over several thousand rotational cycles (Bernhard et al. 2015). The found period (about 3.54 d) is typical for ACV variables. We have to emphasize that this is not the frequency with the highest amplitude because EPIC 202066571 shows a double-wave structure (Fig. 7). Such a behaviour has been observed in several ACV variables (Maitzen 1980; Hümmerich et al. 2016). The classification of the available LAMOST and SDSS spectra according to appropriate Yerkes (MKK) standard stars (Paunzen et al. 2011) results in a spectral type of A0 V SiCrEu, which is typical for a magnetic CP star. As the parameters from Pelisoli et al. (2019) quoted in Table 1 assumed stellar metallicity, the derived Teff is lower than expected for an A0 V. Most importantly, we detected the typical 5200 Å flux depression, as shown in Fig. 7. It was found that this spectral feature occurs solely in these stars and is correlated with the organized local stellar magnetic field (Khan & Shulyak 2007). It is well known that the effects of radiative diffusion are not restricted to the main-sequence domain; they are also predicted in stars with high gravities as well as in subdwarfs (Michaud et al. 2011). However, a detailed abundance analysis on the basis of high resolution spectra for EPIC 202066571 is needed to reveal its true nature. This newly identified ACV variable is the first among sdA stars.
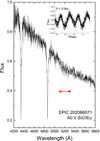 |
Fig. 7. Part of the LAMOST spectrum for the bona fide CP star EPIC 202066571. Marked is the 5200 Å flux depression characteristic for members of this star group. The phased light curve is shown in the upper-right corner. |
3.4. Two composite hot subdwarfs
The SDSS and LAMOST spectra for EPIC 212003762 and EPIC 212137838 seem to indicate that they are B-type stars rather than cooler sdA objects. Luo et al. (2016) classified EPIC 212003762 as a composite of a hot subdwarf and a main-sequence star. For EPIC 212137838, Pérez-Fernández et al. (2016) concluded from a spectral energy distribution (SED) fitting that it is a binary system of a hot component (classification: SdB 0.2 He 9) and a cool component. The classification scheme is according to Drilling et al. (2013).
To further investigate the SED of both objects, we employed the VO Sed Analyzer (VOSA2 v6.0) tool (Bayo et al. 2008) for fitting the available photometry. The contributions of the hot and cool components for each star are visible. The LAMOST and SDSS spectra confirm this conclusion, clearly showing the Mg I triplet at 5180 Å and the G band. Both objects are included in the hot subdwarf catalogue of Geier et al. (2017) as composite hot subdwarfs. As pointed out in Pelisoli et al. (2018a), about 0.5% of the sdA stars are hot subdwarfs with F,G,K companions. The periods observed here are, however, too long for hot pulsating subdwarfs (Holdsworth et al. 2017; Kern et al. 2018). Assuming the variability comes from the B-type component, these objects could be interpreted as slowly pulsating B-type (SPB) stars. They are main-sequence stars of spectral types B2 to B9, which show non-radial g-mode oscillations driven by the κ mechanism acting on the iron bump (Gautschy & Saio 1993). However, as can be clearly seen in Fig. 2, where these objects are shown as cyan pentagons, both are under-luminous, suggesting that they are indeed subdwarfs. In this case, the most plausible explanation for the photometric variability, which is reported here for the first time, is that it actually originates in the cooler, unseen companion and is caused by stellar rotation and convection. It results from the change in brightness as spot(s) move in and out of the visible hemisphere of the star. Tens of thousands of rotational variables have been identified by the Kepler (e.g., Reinhold et al. 2013) and K2 missions (e.g., Reinhold & Hekker 2020). The light curves often show a second period close to the dominant rotation period, as found here, which is interpreted as surface differential rotation. The relatively short rotation periods detected here are consistent with the formation scenario for hot subdwarfs with cool companions (Han et al. 2002): Roche-lobe overflow causes the hot subdwarf progenitor to lose its outer layers, and mass is accreted by the companion, causing it to spin up (see e.g., the v sin i values in Table 5 of Vos et al. 2018).
3.5. Two new ellipsoidal variables
EPIC 212682624 and EPIC 246429212 show light curves (Fig. 6) consistent with ellipsoidal variables (ELLs), similar to, for example, KIC 4570326 (Gaulme & Guzik 2014). This group of variables consists of close binaries whose components are distorted by their mutual gravitation but whose orbital inclinations are too small to show eclipses in the line of sight (Beech 1986). The light variations are a combination of three effects: tidal distortion, reflection, and beaming. Beaming in particular is induced by the stellar radial motion, which results in an increase (decrease) in brightness when the star is approaching (receding from) the observer. Due to these effects and the many free parameters, the light curves of ELLs show a wide variety of shapes and amplitudes (Soszyński et al. 2016).
A good quality SDSS spectrum is available for EPIC 212682624. It is composed of six exposures taken over 25 hours. We noticed a hint of radial velocity variation (around 50 km s−1) between these sub-exposures. Using the package RVSAO (Kurtz & Mink 1998) and a spectral template with the parameters from Table 1, we estimated the radial velocities from each SDSS spectrum. We then calculated the Fourier transform of these velocities, which is shown in Fig. 8. The dashed red line marks the dominant period from the photometry. There are many possible aliases from the radial velocities alone, but one (1.4509 ± 0.2575 c/d) coincides with the photometric period, providing further evidence for the origin of the photometric variability. Figure 9 shows the radial velocities folded to this period, together with a sinusoidal fit, which give an amplitude of K = 40 ± 16 km s−1. Given the large uncertainty in the amplitude, the mass function for the unseen companion is not well constrained (f2 = 0.0047 ± 0.0056 M⊙). Furthermore, this object is located below the main sequence (upper green diamond in Fig. 2) in a region with relatively low extinction (E(B–V) = 0.0279; Schlafly & Finkbeiner 2011). This, combined with the binarity and the ellipsoidal variation, suggests that the object is a pre-ELM with an unseen companion.
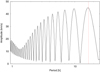 |
Fig. 8. Fourier transform for the SDSS radial velocities of EPIC 212682624. The dashed red line marks the photometric period, which is consistent with one of the possible aliases. |
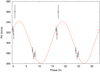 |
Fig. 9. SDSS radial velocities of EPIC 212682624, folded to the period in Fig. 8 that is consistent with the photometric period. The dashed red line shows a sinusoidal fit, assuming a circular orbit. |
EPIC 246429212 was previously selected by Xue et al. (2008) as a blue horizontal branch star candidate. The phased light curve is shown in Fig. 6. The short orbital period suggests that the binary cannot harbour a horizontal branch star. The position far below the main sequence in Fig. 2 also supports the idea that the object is instead an ELM. We obtained radial velocities for this star with the Goodman High Throughput Spectrograph at the SOAR 4 m telescope using a 1200 l/mm grating and a 1″ slit, obtaining a resolution of ≈2 Å, as part of the programme SO2018B-002 (PI: Pelisoli). Each spectrum was paired with an arc-lamp exposure to guarantee precise radial velocities. The radial velocities were calculated in the same way as for EPIC 212682624. These velocities alone do not constrain the period well – many aliases are possible, and similar values of χ2 are obtained assuming a large range of periods (see Fig. 10). The best period given by the radial velocities is 2.8 ± 0.8 c/d, but there is also a possible alias at 4.0214 ± 0.0009 c/d that is more consistent with the photometric variability. Figure 11 shows the obtained orbital solutions assuming these two periods. For the former, the amplitude is 138 ± 5 km s−1, while for the latter it is slightly smaller, 122 ± 6 km s−1. The corresponding binary mass functions are f2 = 0.0979 ± 0.0102 M⊙ and f2 = 0.0473 ± −0.007, respectively. In any case, this is consistent with a pre-ELM with a cool unseen companion, as for EPIC 212682624.
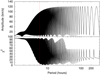 |
Fig. 10. Top panel: Fourier transform for the radial velocities of EPIC 246429212, as obtained from SOAR spectra. Bottom panel: values of χ2 for orbital solutions calculated at each period, assuming a circular orbit. The dashed red line marks the photometric period. The radial velocities do not constrain the period well, but a solution with low χ2 is possible near the photometric period. |
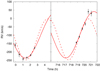 |
Fig. 11. Obtained radial velocities for EPIC 246429212 shown together with two possible solutions. The solid line assumes the period with lowest χ2 in Fig. 10, and for the dashed line we have chosen the alias closest to the photometric period. |
Unfortunately, the mass of the primary in these systems is not straightforward to determine, due to the complicated evolution of ELMs, which involves residual burning and leads to an overlap between evolutionary tracks that show the same value of log g for different combinations of mass, radius, and metallicity (see e.g., Fig. 9 in Istrate et al. 2016 and Fig. 8 in Li et al. 2019). Therefore, further constraints on the ellipsoidal systems cannot be derived with the current set of spectra.
3.6. Other previously known binaries
3.6.1. EPIC 211477347 and 212167054
These are two rather normal Algol-type eclipsing binaries first detected by the Catalina Survey (Drake et al. 2014). However, they are not included in the final catalogue of eclipsing binaries from the Kepler mission (Kirk et al. 2016). Papageorgiou et al. (2018) list a period of 0.7667809 d for EPIC 212167054. The periods suggest that they can consist of normal (i.e., not compact) components (Budding et al. 2004).
3.6.2. EPIC 211617909
Szkody et al. (2009) included this object in their list of cataclysmic variables (CVs) but did not publish any period. Here we report a period of 0.146 d; we also identify its harmonics. Cataclysmic variables are binary star systems consisting of a WD and a normal star companion. They irregularly increase in brightness by a large factor and then drop back down to a quiescent state due to mass transfer and accretion (Abril et al. 2020). EPIC 211617909 is included in the list of known bright WDs by Raddi et al. (2017). The two independent light curves show a quiet irregular behaviour, such as that of the CV variable HV And (Rude & Ringwald 2012). The orbital period of EPIC 211617909 is most likely 0.146 d. Whereas the LAMOST spectrum is very noisy, showing only Hα in emission, the SDSS spectrum clearly shows that most of the hydrogen lines are in emission. Also, the binarity characteristics are visible; this is without any doubt a CV system. The fact that it has been classified as sdA despite the emission lines is a consequence of the SDSS spectral classification pipeline allowing for negative normalization when fitting spectral templates (i.e., Balmer lines in emission can be fitted with an upsidedown A-type spectrum and be erroneously labelled as A type).
3.6.3. EPIC 211378898
EPIC 211378898 is a known U Geminorum-type variable that has been studied for many years (Kato et al. 2017). U Geminorum-type variables are a class of dwarf novae that show long, bright outbursts (super-outbursts) in addition to normal outbursts, and these super-outbursts are believed to be caused by the tidal instability when the disk radius expands to a resonance during an outburst (Osaki 1989). During super-outbursts, variations with periods slightly longer than the orbital period are observed, and they are called super-humps. The orbital period of EPIC 211378898 is about 0.065 d (Mennickent et al. 1996), which is exactly what we have measured in the light curve. The LAMOST and SDSS spectra show the typical strong emission of the hydrogen lines. Like EPIC 211617909, EPIC 211378898 has been classified as sdA due to negative normalization factors being allowed. It should be noted that this short orbital period excludes a main-sequence binary due to the Roche lobe criterion (i.e., at least one of the components should be a compact object; Eggleton 1983).
3.6.4. EPIC 251353301
This star is listed as a W UMa-type variable with a period of 0.3363233 d by Drake et al. (2014). This would perfectly coincidence with the frequency of 2.9724 c/d (Table 2). Although this is the frequency with the lowest signal-to-noise ratio, all other detected frequencies are harmonics of it.
3.7. Other known variable sdA stars in the AAVSO database
To gather further insight into the range of variables within the sdA spectroscopic class, we cross-matched our complete list of sdA candidates with the VSX database maintained by the American Association of Variable Star Observers (AAVSO) and found 120 matches. This is only about 3% of the total sample. It is important to emphasize that no list of apparent non-variable stars exists, especially for the highly accurate space-based datasets. Table 3 lists the statistics of the found variables in the VSX. The largest group are the binaries (CV, EA, EB, EW, and RS), followed by the pulsating stars (DSCT, HADS, RRAB, RRC, RRD, and V361HYA). For the RR Lyrae stars, for example, the period-luminosity relation also depends on the metallicity (Catelan et al. 2004), which could provide interesting insight into the sdA stars. For δ Scuti stars, there is a well-established period-luminosity-colour-metallicity relation (Petersen & Christensen-Dalsgaard 1999) that can be used as for RR Lyrae stars. Furthermore, for the radial δ Scuti-type pulsators of Population I, the observations indicate increasing and decreasing period changes, while most of the Population II counterparts are characterized by sudden jumps (Breger & Pamyatnykh 1998). These jumps have already been successfully observed (Zong et al. 2019). A detailed investigation of all available data on a longer time basis is needed to put further constraints on the evolutionary status of the pulsators.
Types of the 120 known variable stars taken from the VSX.
4. Discussion
Reflecting the inhomogeneity of the sdA spectral class, we find these objects to show a wide range of possible photometric variability. The K2 light curves allow us to confirm that three of the analysed objects (EPIC 202066368, 202067392, and 202066571) are consistent with main-sequence stars, as expected for most sdA stars. A fourth object (EPIC 212168575) is likely a horizontal branch star.
The rate of binaries, in particular with compact companions, seems to be high among photometric variable sdA stars. Only three out of the nine stars identified as binaries have periods long enough to not harbour a compact star. Two of the binaries (EPIC 212682624 and EPIC 246429212) have a (pre-)ELM as a primary, with an unseen cool companion as the secondary. The derived surface gravities would be consistent with metal-poor main-sequence stars (i.e., blue stragglers). If their detected companions are not the objects that donated mass, they could be rare examples of such objects formed in primordial (or dynamically formed) hierarchical triple stars (Perets & Fabrycky 2009).
For the CVs, it is interesting to note that Schenker (2005) suggested that the observed period gap in CVs is created by a superposition of a short-period subdwarf B-type channel and a longer-period post-thermal-timescale mass-transfer channel rather than the conventional model of a single uniform formation channel and disrupted magnetic braking. The detected CVs among the sdA stars could contribute to the analysis of this mechanism.
Within our analysis, about half (12 out of 25) of the objects were found to show no variability on a time basis of 30 days and to have very low amplitudes. There has not yet been any homogeneous and comprehensive study on the incidence of (non-)variable stars across the HRD. However, studying this parameter is of the upmost importance for analysing the current evolutionary status of the sdA stars. Because of their evolutionary history across the HRD, we can expect a different behaviour than that of solar-abundant main-sequence stars. A first basic study in this respect entitled ‘Gaia Data Release 2 – Variable stars in the colour–absolute magnitude diagram’ (Gaia Collaboration 2019) has been published. On the basis of the available Gaia observations, the authors searched for (non-)variable stars for which more than 20 observations in the three different bands are available. This transforms to a precision level of approximately 5 to 10 mag. However, the dataset they used was not published, so an analysis in respect to the sdA stars is not possible.
5. Conclusions
A detailed analysis of the formation and evolution of sdA stars is still in its early stages. One of the insights we have is that the group still consists of many different types of objects, for example metal-poor A/F-type stars in the halo with overestimated surface gravities and extremely low-mass WDs and their precursors (i.e., ELMs and pre-ELMs).
Investigating the variable and apparently non-variable objects among this group will help to shed more light on the astrophysical processes from a different point of view. However, the incidence of apparently non-variable stars is also very important because certain atmospheric conditions, such as the degeneracy of different layers, stratification, strong magnetic fields, accretion, and stellar winds, suppress pulsation.
We have investigated the accurate time series of the Kepler K2 satellite mission available for 25 sdA and candidate sdA stars. Among this sample, we have found 13 variable stars of different types. Among these are classical pulsating stars, ELLs, eclipsing binaries, CVs, and rotationally induced variables. This mixture of types also reflects the mentioned variety of sdA subgroups. For the 12 apparently non-variable stars, we deduced the noise level of the amplitude spectra for different frequency domains in order to account for the quality of the datasets.
This pilot study is just the beginning and is presented to sound the possibilities of using variable stars for the study of sdA stars. The most recent list includes about 3900 members or candidates for this star group. Upcoming datasets, such as from the TESS satellite, will only cover the brighter stars with an accuracy equivalent to that of the Kepler mission. For a further study of the astrophysical parameters of the variable stars, spectroscopic observations, for example radial velocity measurements, are also needed.
Acknowledgments
This work has been supported by the DAAD (project No. 57442043) and the Erasmus+ programme of the European Union under grant number 2020-1-CZ01-KA203-078200. I.P. acknowledges funding by the Deutsche Forschungsgemeinschaft under grant GE2506/12-1. It has also made use of data from the European Space Agency (ESA) mission Gaia (https://www.cosmos.esa.int/gaia), processed by the Gaia Data Processing and Analysis Consortium (DPAC, https://www.cosmos.esa.int/web/gaia/dpac/consortium). Funding for the DPAC has been provided by national institutions, in particular the institutions participating in the Gaia Multilateral Agreement. This paper is dedicated to Holger Pikall who died during its preparation.
References
- Abril, J., Schmidtobreick, L., Ederoclite, A. R., & López-Sanjuan, C. 2020, MNRAS, 492, L40 [NASA ADS] [CrossRef] [Google Scholar]
- Aerts, C., Christensen-Dalsgaard, J., & Kurtz, D. W. 2010, Asteroseismology [Google Scholar]
- Alam, S., Albareti, F. D., Allende Prieto, C., et al. 2015, ApJS, 219, 12 [Google Scholar]
- Anders, F., Khalatyan, A., Chiappini, C., et al. 2019, A&A, 628, A94 [NASA ADS] [CrossRef] [EDP Sciences] [Google Scholar]
- Andrae, R., Fouesneau, M., Creevey, O., et al. 2018, A&A, 616, A8 [NASA ADS] [CrossRef] [EDP Sciences] [Google Scholar]
- Armstrong, D. J., Kirk, J., Lam, K. W. F., et al. 2015, A&A, 579, A19 [NASA ADS] [CrossRef] [EDP Sciences] [Google Scholar]
- Baglin, A., Auvergne, M., Barge, P., et al. 2009, in Transiting Planets, eds. F. Pont, D. Sasselov, & M. J. Holman, IAU Symp., 253, 71 [NASA ADS] [Google Scholar]
- Bai, Y., Liu, J., Bai, Z., Wang, S., & Fan, D. 2019, AJ, 158, 93 [NASA ADS] [CrossRef] [Google Scholar]
- Bailer-Jones, C. A. L., Rybizki, J., Fouesneau, M., Demleitner, M., & Andrae, R. 2021, AJ, 161, 147 [Google Scholar]
- Balona, L. A., Guzik, J. A., Uytterhoeven, K., et al. 2011, MNRAS, 415, 3531 [Google Scholar]
- Bayo, A., Rodrigo, C., Barrado Y Navascués, D., et al. 2008, A&A, 492, 277 [NASA ADS] [CrossRef] [EDP Sciences] [Google Scholar]
- Beech, M. 1986, Ap&SS, 125, 69 [NASA ADS] [CrossRef] [Google Scholar]
- Bell, K. J., Pelisoli, I., Kepler, S. O., et al. 2018, A&A, 617, A6 [NASA ADS] [CrossRef] [EDP Sciences] [Google Scholar]
- Bernhard, K., Hümmerich, S., & Paunzen, E. 2015, Astron. Nachr., 336, 981 [NASA ADS] [CrossRef] [Google Scholar]
- Borucki, W. J., Koch, D., Basri, G., et al. 2010, Science, 327, 977 [Google Scholar]
- Boudreaux, T. M., Barlow, B. N., Fleming, S. W., et al. 2017, ApJ, 845, 171 [NASA ADS] [CrossRef] [Google Scholar]
- Bowman, D. M., Kurtz, D. W., Breger, M., Murphy, S. J., & Holdsworth, D. L. 2016, MNRAS, 460, 1970 [NASA ADS] [CrossRef] [Google Scholar]
- Breger, M., & Pamyatnykh, A. A. 1998, A&A, 332, 958 [NASA ADS] [Google Scholar]
- Brown, W. R., Kilic, M., & Gianninas, A. 2017, ApJ, 839, 23 [CrossRef] [Google Scholar]
- Brown, W. R., Kilic, M., Kosakowski, A., et al. 2020, ApJ, 889, 49 [Google Scholar]
- Budding, E., Erdem, A., Çiçek, C., et al. 2004, A&A, 417, 263 [NASA ADS] [CrossRef] [EDP Sciences] [Google Scholar]
- Carbon, D. F., Henze, C., & Nelson, B. C. 2017, ApJS, 228, 19 [NASA ADS] [CrossRef] [Google Scholar]
- Catelan, M., & Smith, H. A. 2015, Pulsating Stars [Google Scholar]
- Catelan, M., Pritzl, B. J., & Smith, H. A. 2004, ApJS, 154, 633 [Google Scholar]
- Cui, X.-Q., Zhao, Y.-H., Chu, Y.-Q., et al. 2012, Res. Astron. Astrophys., 12, 1197 [Google Scholar]
- Drake, A. J., Graham, M. J., Djorgovski, S. G., et al. 2014, ApJS, 213, 9 [Google Scholar]
- Drilling, J. S., Jeffery, C. S., Heber, U., Moehler, S., & Napiwotzki, R. 2013, A&A, 551, A31 [NASA ADS] [CrossRef] [EDP Sciences] [Google Scholar]
- Eggleton, P. P. 1983, ApJ, 268, 368 [Google Scholar]
- Eisenstein, D. J., Weinberg, D. H., Agol, E., et al. 2011, AJ, 142, 72 [Google Scholar]
- Gaia Collaboration (Babusiaux, C., et al.) 2018, A&A, 616, A10 [NASA ADS] [CrossRef] [EDP Sciences] [Google Scholar]
- Gaia Collaboration (Eyer, L., et al.) 2019, A&A, 623, A110 [NASA ADS] [CrossRef] [EDP Sciences] [Google Scholar]
- Gaulme, P., & Guzik, J. A. 2014, in Precision Asteroseismology, eds. J. A. Guzik, W. J. Chaplin, G. Handler, & A. Pigulski, IAU Symp., 301, 413 [Google Scholar]
- Gautschy, A., & Saio, H. 1993, MNRAS, 262, 213 [NASA ADS] [CrossRef] [Google Scholar]
- Geier, S., Østensen, R. H., Nemeth, P., et al. 2017, A&A, 600, A50 [NASA ADS] [CrossRef] [EDP Sciences] [Google Scholar]
- Guzik, J. A., Kaye, A. B., Bradley, P. A., Cox, A. N., & Neuforge, C. 2000, ApJ, 542, L57 [Google Scholar]
- Han, Z., Podsiadlowski, P., Maxted, P. F. L., Marsh, T. R., & Ivanova, N. 2002, MNRAS, 336, 449 [Google Scholar]
- Handler, G. 2009, in American Institute of Physics Conference Series, eds. J. A. Guzik, & P. A. Bradley, AIP Conf. Ser., 1170, 403 [NASA ADS] [Google Scholar]
- Heber, U. 2016, PASP, 128, 082001 [Google Scholar]
- Holdsworth, D. L., Østensen, R. H., Smalley, B., & Telting, J. H. 2017, MNRAS, 466, 5020 [Google Scholar]
- Hümmerich, S., Paunzen, E., & Bernhard, K. 2016, AJ, 152, 104 [CrossRef] [Google Scholar]
- Ibanoglu, C., Çakırlı, Ö., & Sipahi, E. 2018, New Astron., 62, 70 [CrossRef] [Google Scholar]
- Istrate, A. G., Marchant, P., Tauris, T. M., et al. 2016, A&A, 595, A35 [NASA ADS] [CrossRef] [EDP Sciences] [Google Scholar]
- Kato, T., Isogai, K., Hambsch, F.-J., et al. 2017, PASJ, 69, 75 [Google Scholar]
- Kaye, A. B., Handler, G., Krisciunas, K., Poretti, E., & Zerbi, F. M. 1999, PASP, 111, 840 [Google Scholar]
- Kepler, S. O., Pelisoli, I., Koester, D., et al. 2016, MNRAS, 455, 3413 [NASA ADS] [CrossRef] [Google Scholar]
- Kern, J. W., Reed, M. D., Baran, A. S., Telting, J. H., & Østensen, R. H. 2018, MNRAS, 474, 4709 [Google Scholar]
- Khan, S. A., & Shulyak, D. V. 2007, A&A, 469, 1083 [NASA ADS] [CrossRef] [EDP Sciences] [Google Scholar]
- Kilic, M., Stanek, K. Z., & Pinsonneault, M. H. 2007, ApJ, 671, 761 [NASA ADS] [CrossRef] [Google Scholar]
- Kirk, B., Conroy, K., Prša, A., et al. 2016, AJ, 151, 68 [Google Scholar]
- Kleinman, S. J., Kepler, S. O., Koester, D., et al. 2013, ApJS, 204, 5 [NASA ADS] [CrossRef] [Google Scholar]
- Koester, D. 2010, Mem. Soc. Astron. Ital., 81, 921 [Google Scholar]
- Koester, D., & Kepler, S. O. 2015, A&A, 583, A86 [NASA ADS] [CrossRef] [EDP Sciences] [Google Scholar]
- Koester, D., Weidemann, V., & Zeidler, E. M. 1982, A&A, 116, 147 [NASA ADS] [Google Scholar]
- Kurtz, M. J., & Mink, D. J. 1998, PASP, 110, 934 [NASA ADS] [CrossRef] [Google Scholar]
- Langer, N. 2004, in Cosmochemistry. The melting pot of the elements, eds. C. Esteban, R. García López, A. Herrero, & F. Sánchez, 31 [CrossRef] [Google Scholar]
- Lauffer, G. R., Romero, A. D., & Kepler, S. O. 2018, MNRAS, 480, 1547 [NASA ADS] [CrossRef] [Google Scholar]
- Lenz, P., & Breger, M. 2005, Commun. Asteroseismol., 146, 53 [Google Scholar]
- Li, Z., Chen, X., Chen, H.-L., & Han, Z. 2019, ApJ, 871, 148 [NASA ADS] [CrossRef] [Google Scholar]
- Luo, Y.-P., Németh, P., Liu, C., Deng, L.-C., & Han, Z.-W. 2016, ApJ, 818, 202 [NASA ADS] [CrossRef] [Google Scholar]
- Luo, A. L., Zhao, Y. H., Zhao, G., et al. 2019, VizieR Online Data Catalog: V/164 [Google Scholar]
- Maitzen, H. M. 1980, A&A, 89, 230 [NASA ADS] [Google Scholar]
- Mennickent, B., Nogami, D., Kato, T., & Worraker, W. 1996, in Superhumps in the SU UMa star AK CNC, eds. A. Evans, & J. H. Wood, Astrophys. Space Sci. Lib., 208, 61 [NASA ADS] [Google Scholar]
- Michaud, G., Megessier, C., & Charland, Y. 1981, A&A, 103, 244 [NASA ADS] [Google Scholar]
- Michaud, G., Richer, J., & Richard, O. 2011, A&A, 529, A60 [NASA ADS] [CrossRef] [EDP Sciences] [Google Scholar]
- Montet, B. T., Tovar, G., & Foreman-Mackey, D. 2017, ApJ, 851, 116 [Google Scholar]
- Osaki, Y. 1989, PASJ, 41, 1005 [NASA ADS] [Google Scholar]
- Papageorgiou, A., Catelan, M., Christopoulou, P.-E., Drake, A. J., & Djorgovski, S. G. 2018, ApJS, 238, 4 [NASA ADS] [CrossRef] [Google Scholar]
- Paunzen, E., & Vanmunster, T. 2016, Astron. Nachr., 337, 239 [NASA ADS] [CrossRef] [Google Scholar]
- Paunzen, E., Netopil, M., Pintado, O. I., & Rode-Paunzen, M. 2011, Astron. Nachr., 332, 77 [NASA ADS] [CrossRef] [Google Scholar]
- Pelisoli, I., Kepler, S. O., & Koester, D. 2018a, MNRAS, 475, 2480 [NASA ADS] [CrossRef] [Google Scholar]
- Pelisoli, I., Kepler, S. O., Koester, D., et al. 2018b, MNRAS, 478, 867 [Google Scholar]
- Pelisoli, I., Bell, K. J., Kepler, S. O., & Koester, D. 2019, MNRAS, 482, 3831 [NASA ADS] [CrossRef] [Google Scholar]
- Perets, H. B., & Fabrycky, D. C. 2009, ApJ, 697, 1048 [Google Scholar]
- Pérez-Fernández, E., Ulla, A., Solano, E., Oreiro, R., & Rodrigo, C. 2016, MNRAS, 457, 3396 [CrossRef] [Google Scholar]
- Petersen, J. O., & Christensen-Dalsgaard, J. 1999, A&A, 352, 547 [NASA ADS] [Google Scholar]
- Pietrzyński, G., Thompson, I. B., Gieren, W., et al. 2012, Nature, 484, 75 [CrossRef] [Google Scholar]
- Plachy, E., Molnár, L., Bódi, A., et al. 2019, ApJS, 244, 32 [CrossRef] [Google Scholar]
- Raddi, R., Gentile Fusillo, N. P., Pala, A. F., et al. 2017, MNRAS, 472, 4173 [NASA ADS] [CrossRef] [Google Scholar]
- Reed, M. D., Armbrecht, E. L., Telting, J. H., et al. 2018, MNRAS, 474, 5186 [NASA ADS] [CrossRef] [Google Scholar]
- Reinhold, T., & Hekker, S. 2020, A&A, 635, A43 [NASA ADS] [CrossRef] [EDP Sciences] [Google Scholar]
- Reinhold, T., Reiners, A., & Basri, G. 2013, A&A, 560, A4 [NASA ADS] [CrossRef] [EDP Sciences] [Google Scholar]
- Romero, A. D., Campos, F., & Kepler, S. O. 2015, MNRAS, 450, 3708 [NASA ADS] [CrossRef] [Google Scholar]
- Rude, G. D., & Ringwald, F. A. 2012, New Astron., 17, 442 [NASA ADS] [CrossRef] [Google Scholar]
- Schenker, K. 2005, in Subdwarf B Binaries as an Important Progenitor Channel for Cataclysmic Variables, eds. D. Koester, & S. Moehler, ASP Conf. Ser., 334, 351 [Google Scholar]
- Schlafly, E. F., & Finkbeiner, D. P. 2011, ApJ, 737, 103 [Google Scholar]
- Sesar, B., Ivezić, Ž., Stuart, J. S., et al. 2013, AJ, 146, 21 [NASA ADS] [CrossRef] [Google Scholar]
- Smith, K. W., Bailer-Jones, C. A. L., Klement, R. J., & Xue, X. X. 2010, A&A, 522, A88 [NASA ADS] [CrossRef] [EDP Sciences] [Google Scholar]
- Soszyński, I., Pawlak, M., Pietrukowicz, P., et al. 2016, Acta Astron., 66, 405 [NASA ADS] [Google Scholar]
- Stibbs, D. W. N. 1950, MNRAS, 110, 395 [Google Scholar]
- Szkody, P., Anderson, S. F., Hayden, M., et al. 2009, AJ, 137, 4011 [NASA ADS] [CrossRef] [Google Scholar]
- Vanderburg, A., & Johnson, J. A. 2014, PASP, 126, 948 [Google Scholar]
- Vanderspek, R. 2019, AAS/Division for Extreme Solar Systems Abstracts, 51, 333.12 [NASA ADS] [Google Scholar]
- Vos, J., Németh, P., Vučković, M., Østensen, R., & Parsons, S. 2018, MNRAS, 473, 693 [NASA ADS] [CrossRef] [Google Scholar]
- Watson, C. L., Henden, A. A., & Price, A. 2006, Soc. Astron. Sci. Ann. Symp., 25, 47 [NASA ADS] [Google Scholar]
- Xue, X. X., Rix, H. W., Zhao, G., et al. 2008, ApJ, 684, 1143 [Google Scholar]
- Yu, J., Li, Z., Zhu, C., et al. 2019, ApJ, 885, 20 [NASA ADS] [CrossRef] [Google Scholar]
- Ziaali, E., Bedding, T. R., Murphy, S. J., Van Reeth, T., & Hey, D. R. 2019, MNRAS, 486, 4348 [NASA ADS] [CrossRef] [Google Scholar]
- Zong, P., Esamdin, A., Fu, J. N., et al. 2019, PASP, 131, 064202 [NASA ADS] [CrossRef] [Google Scholar]
All Tables
All Figures
|
Fig. 1. Amplitude spectrum of the apparent non-variable star EPIC 220489294, showing how the variability threshold is defined. |
| In the text | |
|
Fig. 2. HRD, i.e., MG versus (BP − RP) diagram, of our targets, together with stars from the Sample C presented in Gaia Collaboration (2018) for guidance. The location of our targets together with their variability type is marked with different symbols. ‘NOV’ indicates that the target was ‘not observed to vary’. The remaining acronyms are the same as in Table 2. |
| In the text | |
|
Fig. 3. Comparison of the Teff (lower panel) and log g (upper panel) values with those from the literature. The log g values were derived by automatic pipelines (Andrae et al. 2018; Anders et al. 2019; Bai et al. 2019). |
| In the text | |
|
Fig. 4. Light curves of the pulsating star EPIC 202066368 (upper panel) and the rotational-induced variability of EPIC 212003762 (lower panel). The multi-periodic variations for EPIC 202066368 are clearly visible. |
| In the text | |
|
Fig. 5. Rich amplitude spectrum of the variable of the δ Scuti-type pulsator EPIC 202067392. The found amplitudes and the noise level are quite small. |
| In the text | |
|
Fig. 6. Phased light curves of EPIC 212168575 (upper panel), EPIC 212682624 (middle panel), and EPIC 246429212 (lower panel). |
| In the text | |
|
Fig. 7. Part of the LAMOST spectrum for the bona fide CP star EPIC 202066571. Marked is the 5200 Å flux depression characteristic for members of this star group. The phased light curve is shown in the upper-right corner. |
| In the text | |
|
Fig. 8. Fourier transform for the SDSS radial velocities of EPIC 212682624. The dashed red line marks the photometric period, which is consistent with one of the possible aliases. |
| In the text | |
|
Fig. 9. SDSS radial velocities of EPIC 212682624, folded to the period in Fig. 8 that is consistent with the photometric period. The dashed red line shows a sinusoidal fit, assuming a circular orbit. |
| In the text | |
|
Fig. 10. Top panel: Fourier transform for the radial velocities of EPIC 246429212, as obtained from SOAR spectra. Bottom panel: values of χ2 for orbital solutions calculated at each period, assuming a circular orbit. The dashed red line marks the photometric period. The radial velocities do not constrain the period well, but a solution with low χ2 is possible near the photometric period. |
| In the text | |
|
Fig. 11. Obtained radial velocities for EPIC 246429212 shown together with two possible solutions. The solid line assumes the period with lowest χ2 in Fig. 10, and for the dashed line we have chosen the alias closest to the photometric period. |
| In the text | |
Current usage metrics show cumulative count of Article Views (full-text article views including HTML views, PDF and ePub downloads, according to the available data) and Abstracts Views on Vision4Press platform.
Data correspond to usage on the plateform after 2015. The current usage metrics is available 48-96 hours after online publication and is updated daily on week days.
Initial download of the metrics may take a while.