Fig. 3
Download original image
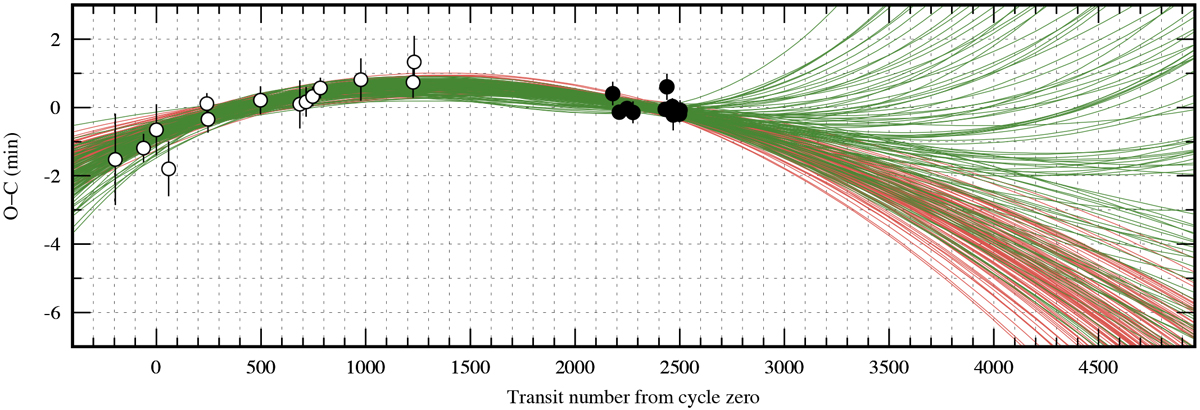
Timing residuals against the refined linear ephemeris. Data points are coded as in Fig. 2, and the data from Sokov et al. (2018) are skipped for clarity. The green and red lines show the periodic and quadratic-trend scenarios, respectively. Each bunch consists of 100 lines randomly picked from the Markov chains. Both scenarios remain statistically undistinguished in the time covered by current observations. The models are extrapolated to the next ten years to illustrate the broad spectrum of possible solutions.
Current usage metrics show cumulative count of Article Views (full-text article views including HTML views, PDF and ePub downloads, according to the available data) and Abstracts Views on Vision4Press platform.
Data correspond to usage on the plateform after 2015. The current usage metrics is available 48-96 hours after online publication and is updated daily on week days.
Initial download of the metrics may take a while.