Fig. 2
Download original image
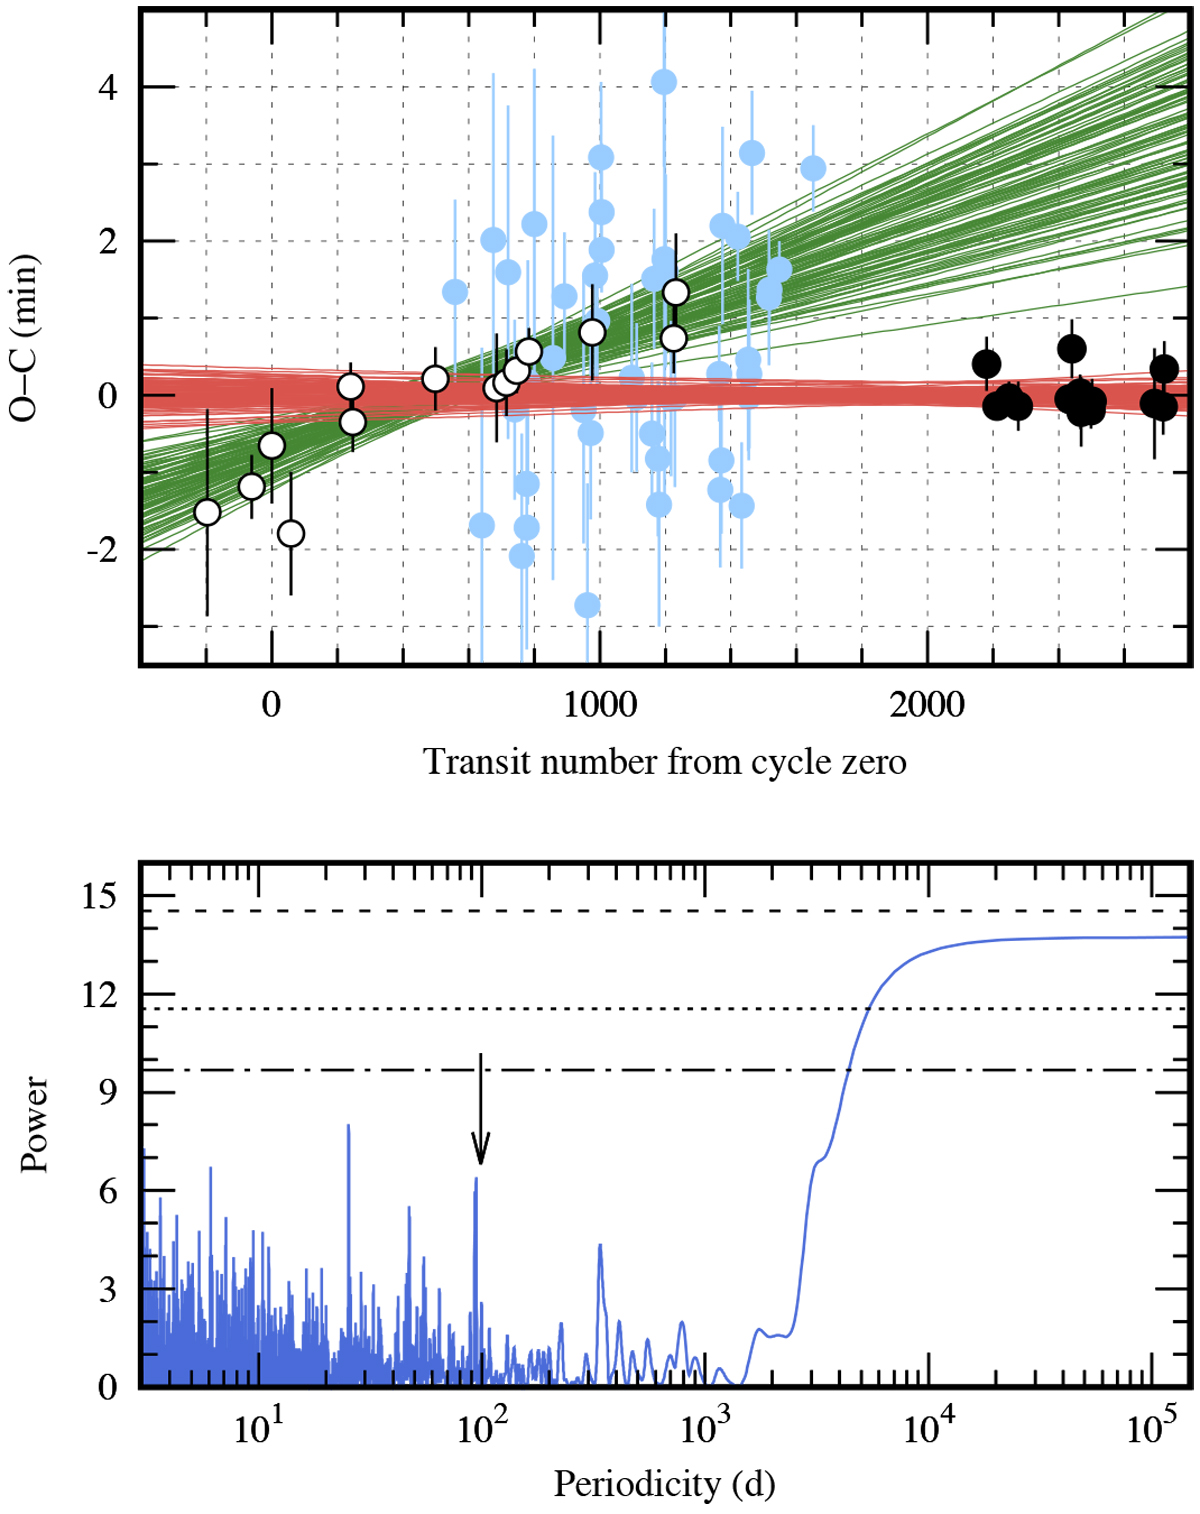
Upper panel: transit timing residuals against the refined linear ephemeris. The new observations are marked with filled black dots, and the mid-transit times from Maciejewski et al. (2016b) are marked with open circles. The light blue filled dots show data from Sokov et al. (2018). The uncertainties of the refined ephemeris are illustrated with a bunch of 100 red lines drawn from the Markov chains. The green lines show the ephemeris from Maciejewski et al. (2016b) for comparison. Lower panel: AoV periodogram generated for transit timing residuals. The dashed horizontal lines place the empirical FAP levels of 5, 1, and 0.1% (from the bottom up). The location of the periodicity of ~99 days that was claimed by Sokov et al. (2018) is marked with an arrow.
Current usage metrics show cumulative count of Article Views (full-text article views including HTML views, PDF and ePub downloads, according to the available data) and Abstracts Views on Vision4Press platform.
Data correspond to usage on the plateform after 2015. The current usage metrics is available 48-96 hours after online publication and is updated daily on week days.
Initial download of the metrics may take a while.