Fig. 1
Download original image
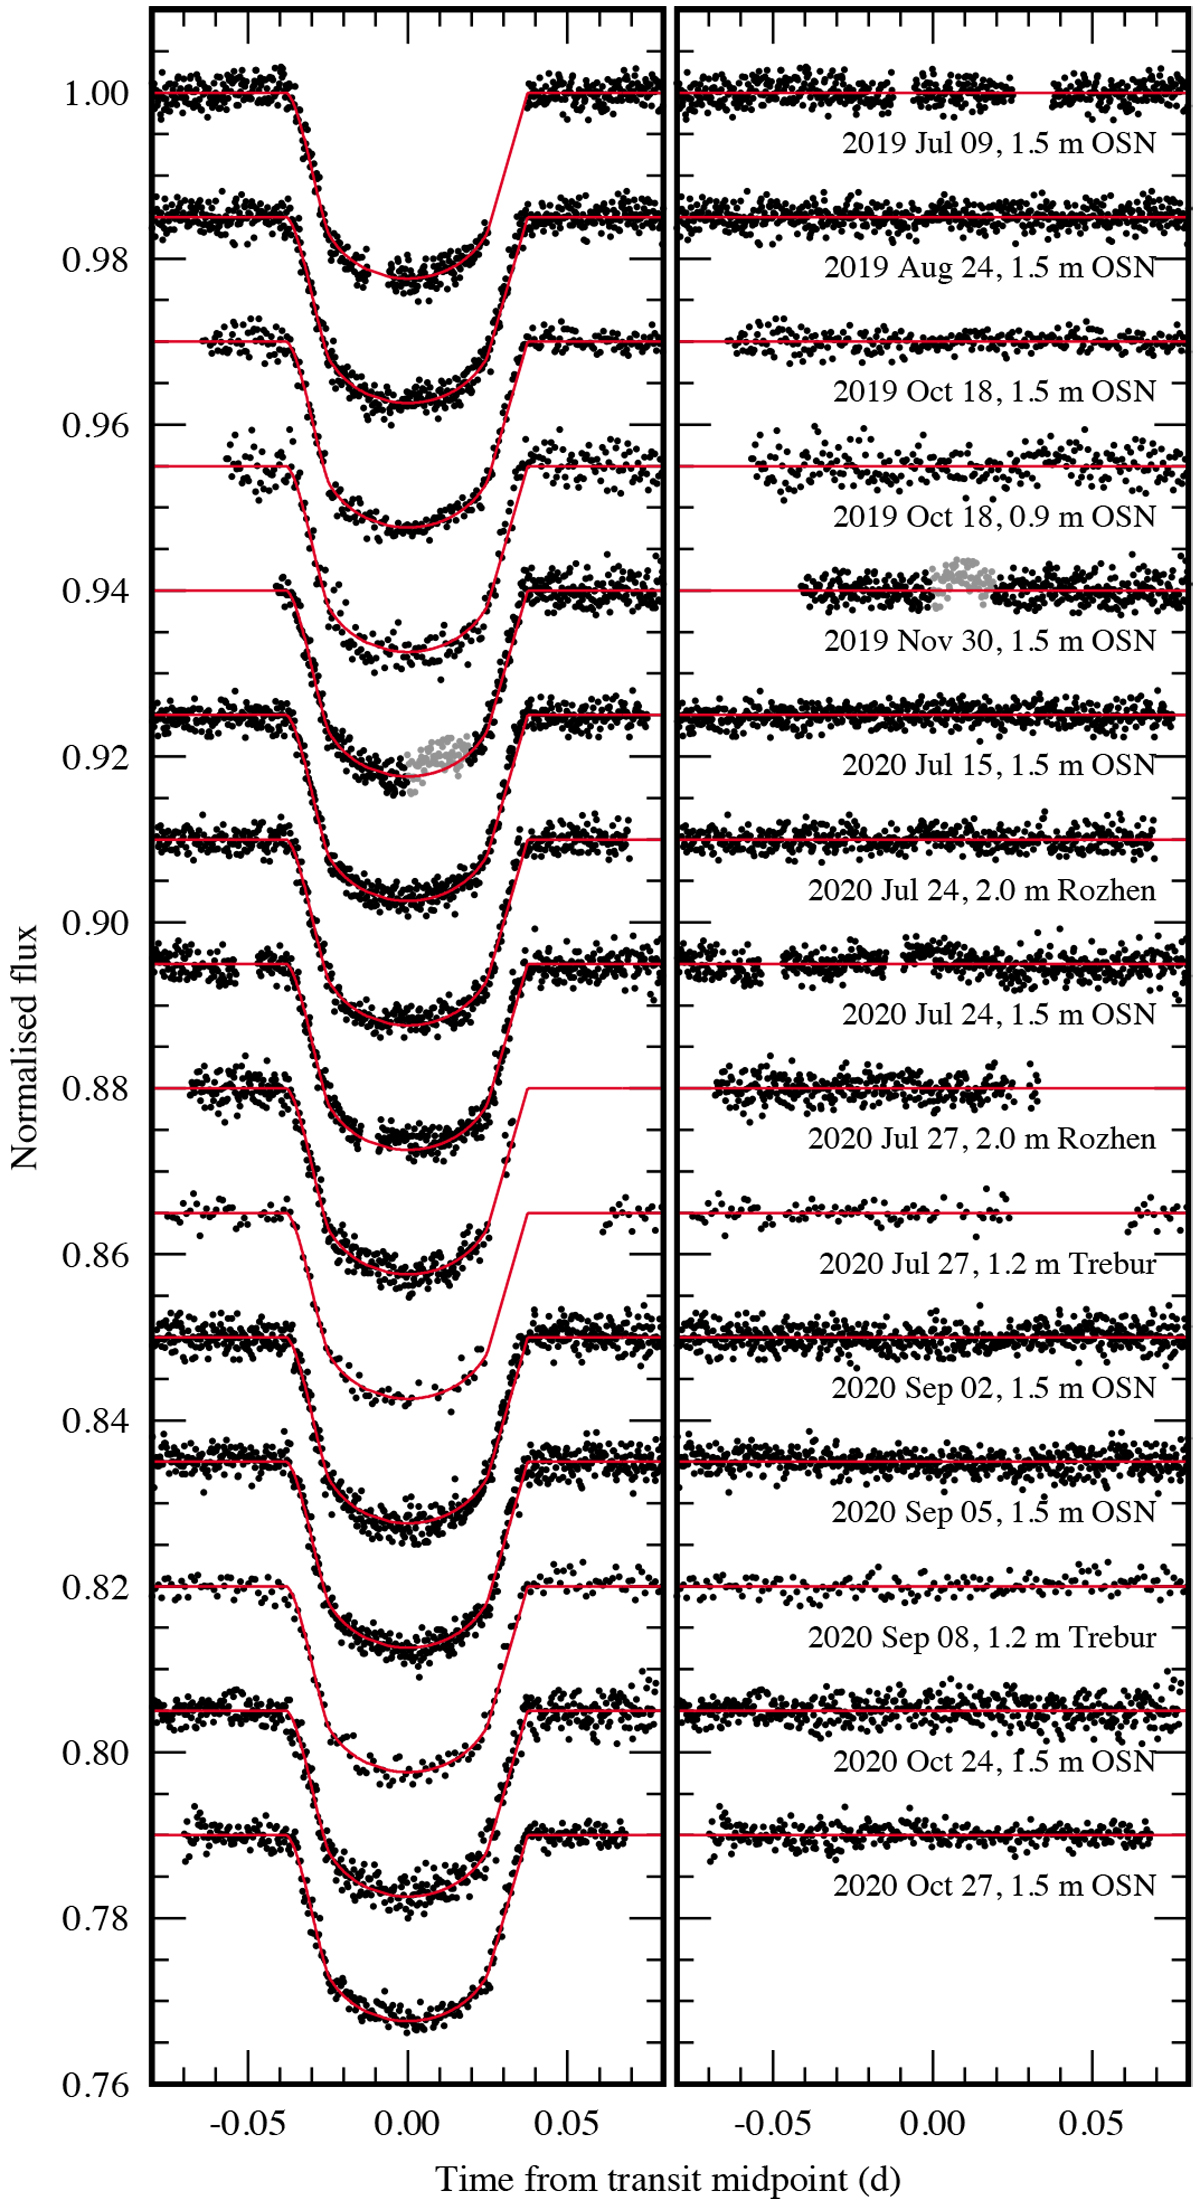
Left: new transit light curves for TrES-5 b, sorted by the observation date and, if observed simultaneously, by the telescope’s aperture size. The best-fitting model is drawn with red lines. A signature of starspot occultation identified in the light curve acquired on 2019 November 30 is marked with grey points. These measurements were masked out in transit modelling. Right: photometric residuals from the transit model.
Current usage metrics show cumulative count of Article Views (full-text article views including HTML views, PDF and ePub downloads, according to the available data) and Abstracts Views on Vision4Press platform.
Data correspond to usage on the plateform after 2015. The current usage metrics is available 48-96 hours after online publication and is updated daily on week days.
Initial download of the metrics may take a while.