Fig. 6.
Download original image
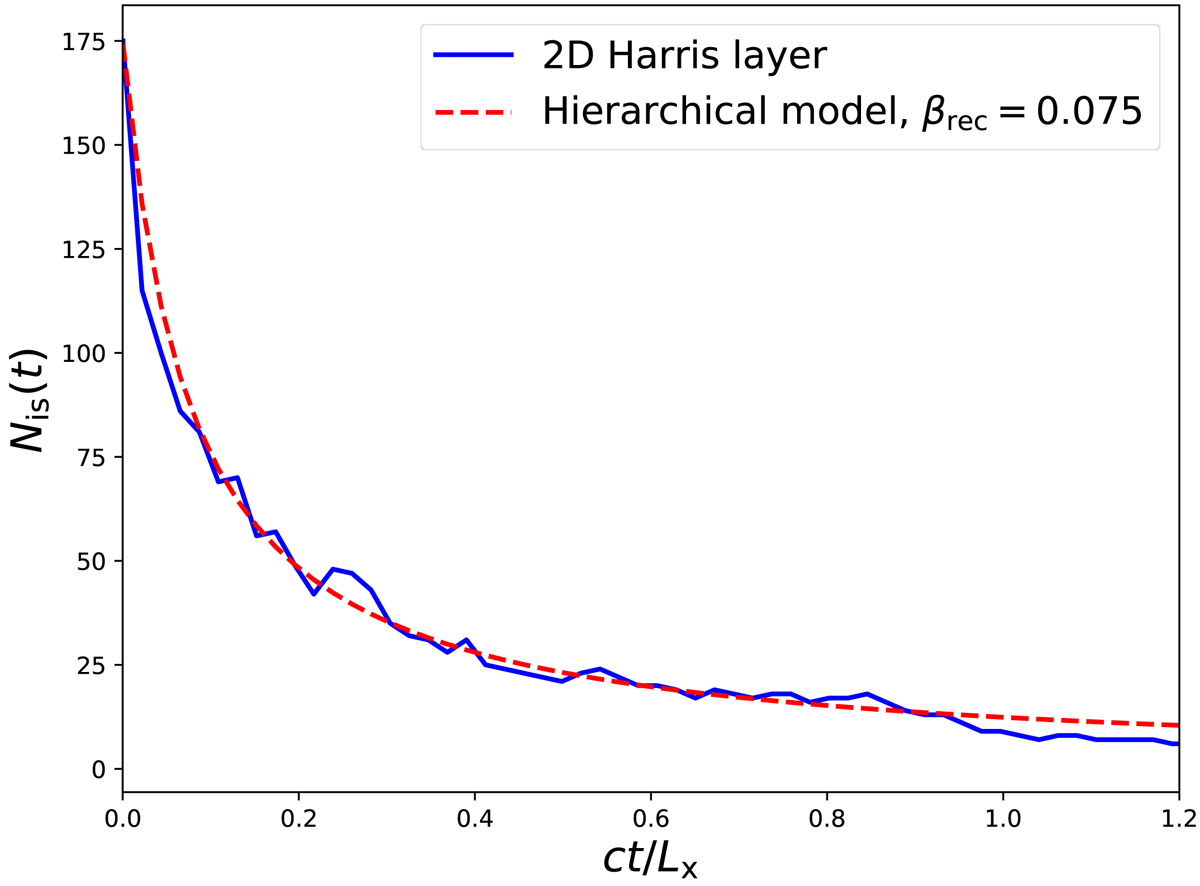
Time evolution of the number of plasmoids measured in a 2D Cartesian PIC simulation initialized with a Harris layer of total length Lx (solid blue line), and comparison with the hierarchical model with a best-fit reconnection rate βrec = 0.075 (dashed red line). Small secondary plasmoids forming in the late stages of reconnection between giant plasmoids are not considered in this measurement.
Current usage metrics show cumulative count of Article Views (full-text article views including HTML views, PDF and ePub downloads, according to the available data) and Abstracts Views on Vision4Press platform.
Data correspond to usage on the plateform after 2015. The current usage metrics is available 48-96 hours after online publication and is updated daily on week days.
Initial download of the metrics may take a while.