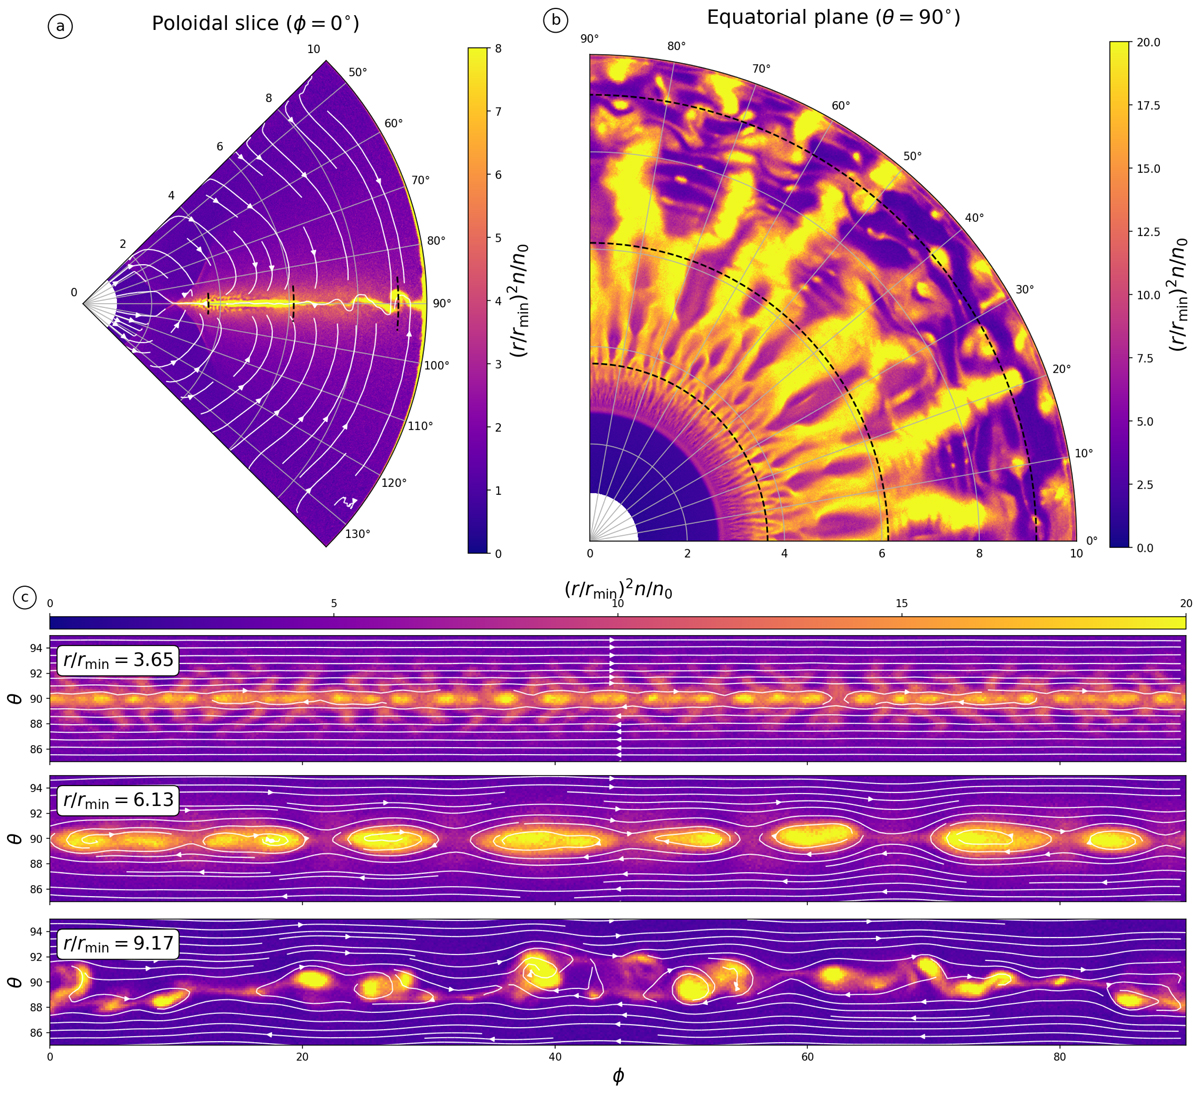
Fig. 3.
Download original image
Two-dimensional slices through the 3D plasma density map shown in Fig. 2 (σ = 4.5, t = 8.44 rmin/c). Panel a: poloidal cut at ϕ = 0°. White solid lines with arrows represent the plasma bulk velocity streamlines. Panel b: equatorial cut (θ = π/2). Panel c: cuts through the θϕ plane at r/rmin = 3.65, 6.13, and 9.17, zoomed-in on the current layer. These radii are indicated by dashed black lines in panels a and b. Panel c: white contours with arrows show the magnetic field lines.
Current usage metrics show cumulative count of Article Views (full-text article views including HTML views, PDF and ePub downloads, according to the available data) and Abstracts Views on Vision4Press platform.
Data correspond to usage on the plateform after 2015. The current usage metrics is available 48-96 hours after online publication and is updated daily on week days.
Initial download of the metrics may take a while.